Seagate IronWolf Pro 22TB HDD Capsule Review
by Ganesh T S on January 2, 2024 4:30 PM EST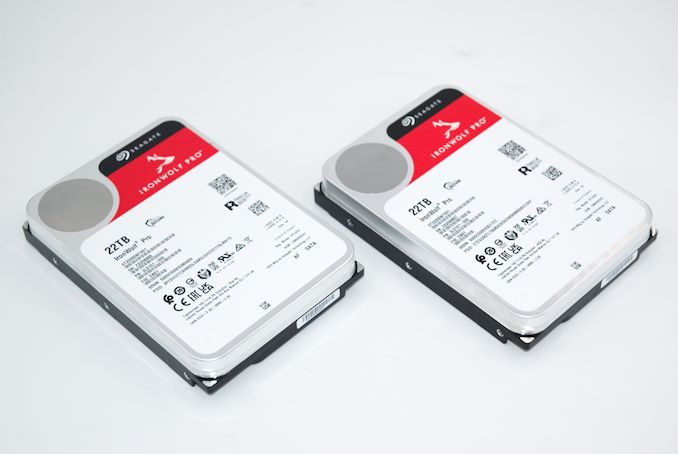
Seagate's IronWolf Pro lineup of hard drives for network-attached storage units has consistently offered good value for money, particularly at the highest capacity points. I purchased two 22TB IronWolf Pro drives for production deployment late last year. As part of the burn-in testing prior to actual deployment, they were put through our evaluation routine for direct-attached storage drives in both internal and external (Thunderbolt 3 DAS) modes. This capsule review presents an overview of the performance you can expect from the drive in standalone, RAID 0, and RAID 1 modes.
Introduction and Product Specifications
Data storage requirements have kept increasing over the last several years. SSDs have taken over the role of the primary drive in most computing systems. However, when it comes to sheer bulk storage, hard drives (HDDs) continue to be the storage media of choice in areas dealing with large amounts of relatively cold data. The Seagate IronWolf Pro NAS hard drive family targets NAS units up to 24 bays and is meant for creative professionals, SOHO, and small-to-medium enterprises. These CMR SATA drives have a workload rating of 550 TB/yr, unrecoverable read error rate (URE) of 1 in 10E15, MTBF of 1.2M hours, and a rated load/unload cycle of 600K for the heads. The family carries a 5-year warranty. The 22TB version contains ten platters with an areal density of 1260 Gb/in2. It has a 512MB DRAM cache. Acoustics range from 20 dBA to 34 dBA depending upon the operating mode.
We put two IronWolf Pro 22TB NAS HDDs to test in three distinct configurations:
- Standalone SATA drive (internal storage mode) in our legacy SATA HDD testbed that was also used in the Seagate BarraCuda Pro 14TB review.
- RAID0 in the OWC / Akitio Thunder 3 Duo Pro connected via Thunderbolt 3 to our current DAS testbed.
- RAID1 in the OWC / Akitio Thunder 3 Duo Pro connected via Thunderbolt 3 to our current DAS testbed.
All systems were updated to the latest version of Windows 11 22H2. It must be noted that for the last several years Windows has been interfering with the performance of removable storage drives connected via Thunderbolt / PCIe by disabling the write caching completely. Therefore, the RAID0 and RAID1 configurations were evaluated in two modes each - one with write caching off (default / 'Quick removal' under Disk Properties > Policy), and another with the write caching on ('Better performance' mode under Disk Properties > Policy).
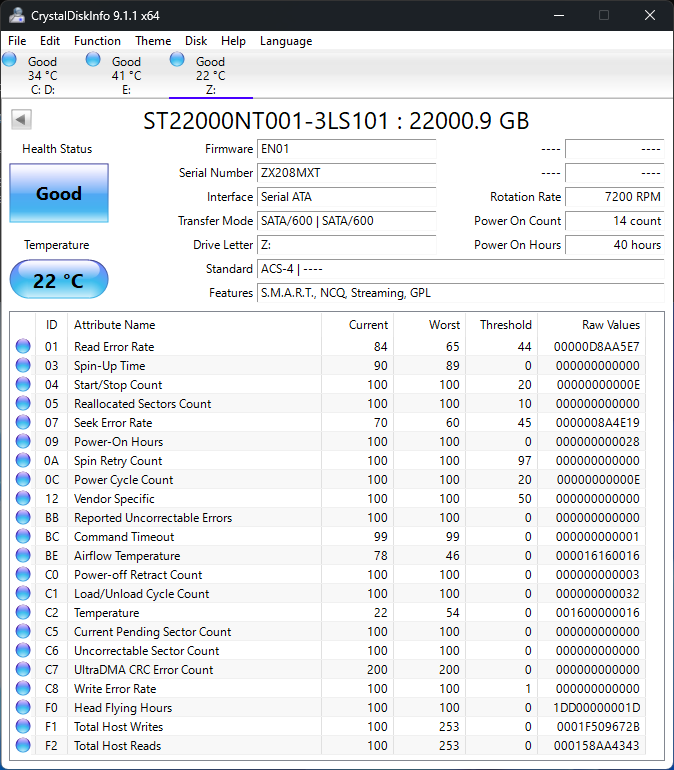
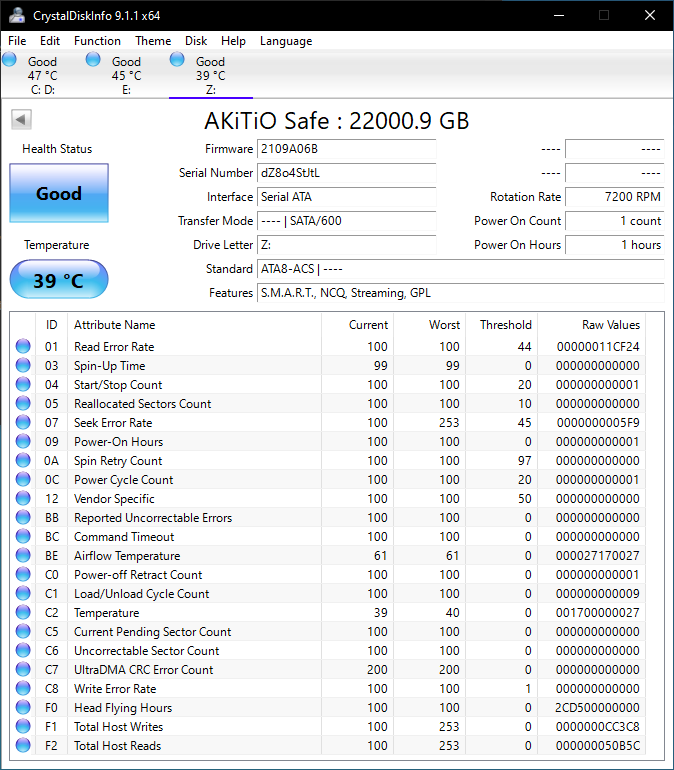
The S.M.A.R.T readout for the different configurations are presented below.
| S.M.A.R.T Passthrough - CrystalDiskInfo | |
 |
 |
Synthetic Benchmarks - ATTO and CrystalDiskMark
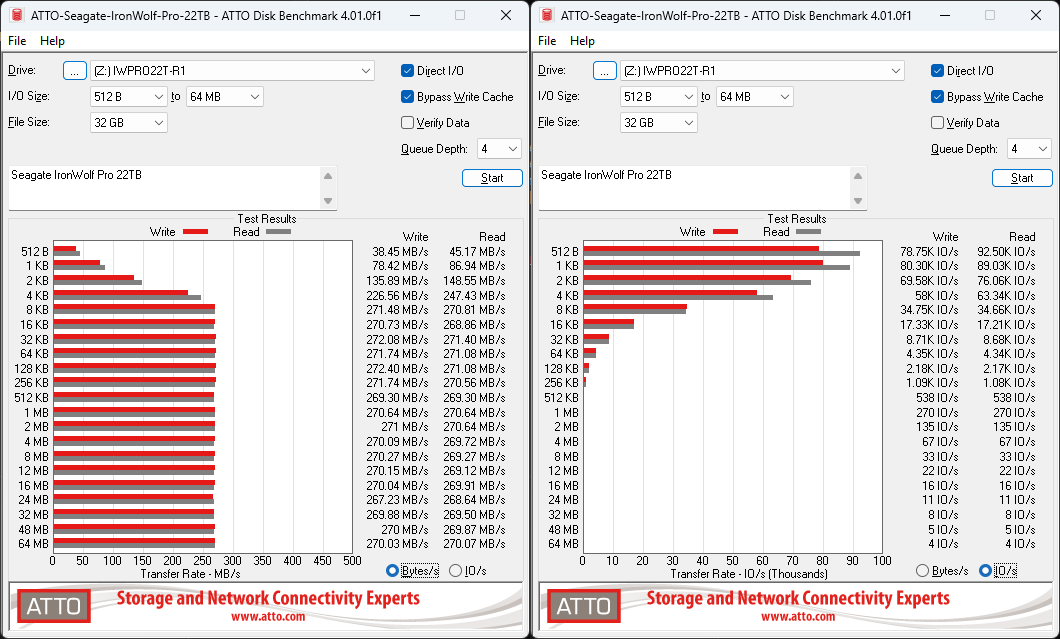
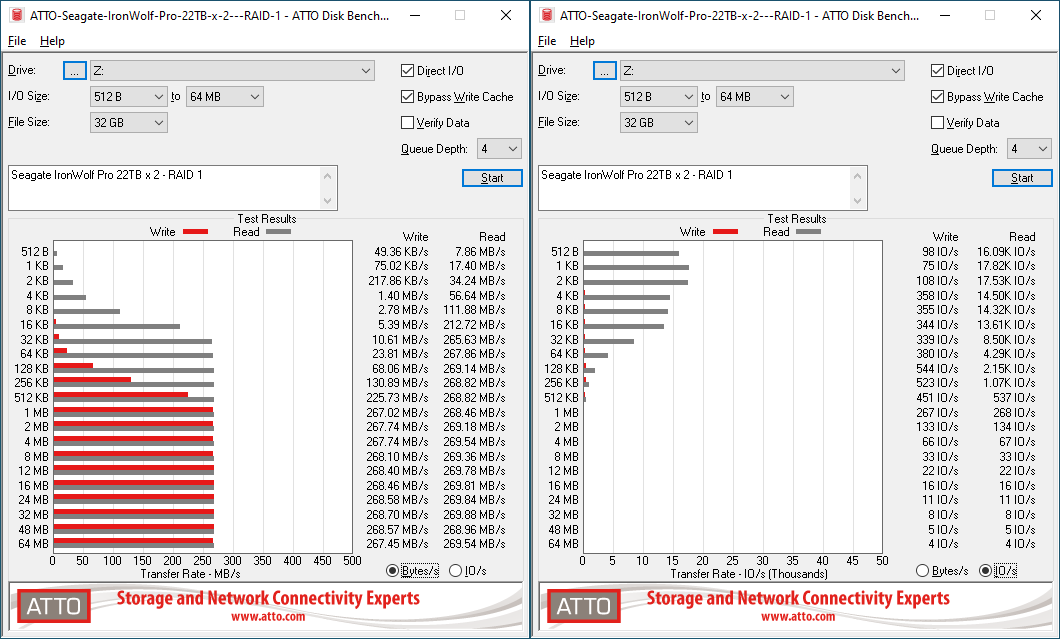
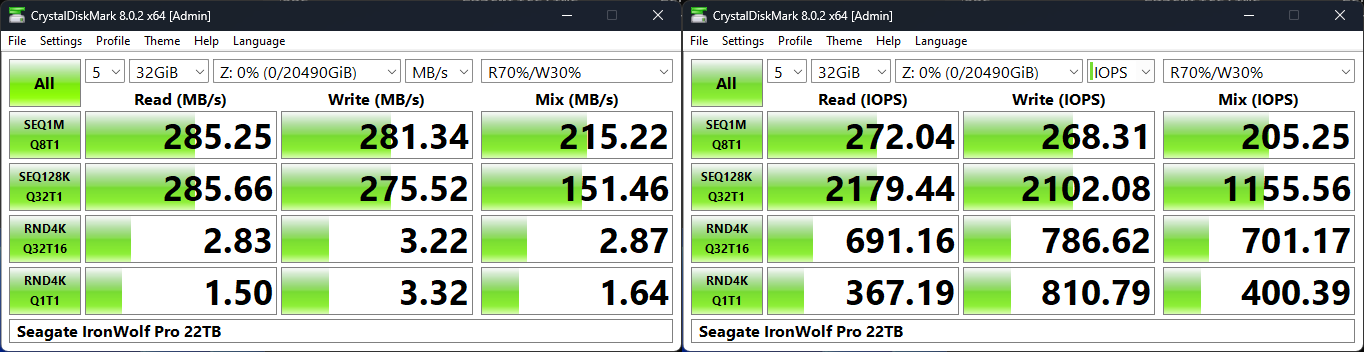
Benchmarks such as ATTO and CrystalDiskMark help provide a quick look at the performance of the storage devices. Seagate claims speeds of up to 285 MBps. This is easily hit at higher queue depths in the CrystalDiskMark sequential workloads. ATTO numbers reach up to 270 MBps for sequential workloads with transfer sizes as small as 8KB.
| ATTO Benchmarks | |
| TOP: | BOTTOM: |
 |
|
 |
|
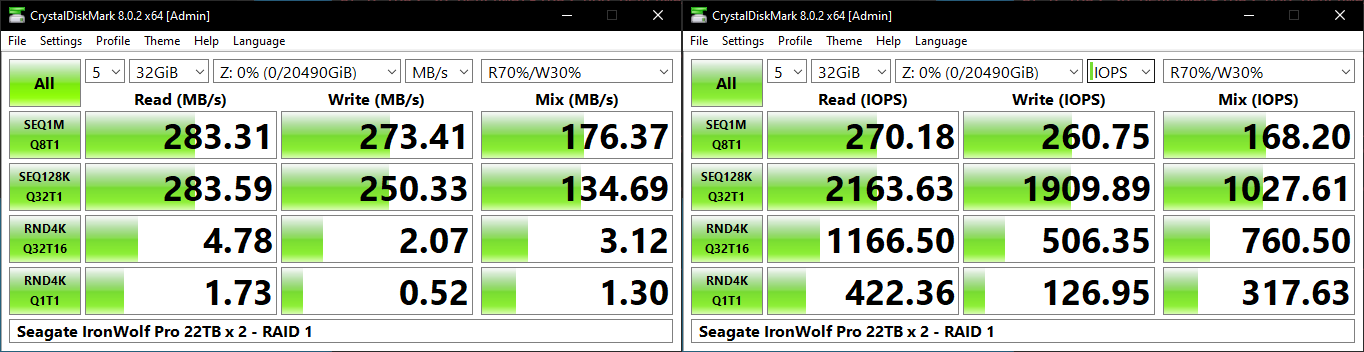
CrystalDiskMark uses four different access traces for reads and writes over a configurable region size. Two of the traces are sequential accesses, while two are 4K random accesses. Internally, CrystalDiskMark uses the Microsoft DiskSpd storage testing tool. The 'Seq128K Q32T1' sequential traces use 128K block size with a queue depth of 32 from a single thread, while the '4K Q32T16' one does random 4K accesses with the same queue configuration, but from multiple threads. The 'Seq1M' traces use a 1MiB block size. The plain 'Rnd4K' one uses only a single queue and single thread .
| CrystalDiskMark Benchmarks | |
| TOP: | BOTTOM: |
 |
|
 |
|
Real-World Benchmarking - File Transfer Workloads
Most of the NAS disk activity in home consumer and SOHO use-cases is related to file transfers. This may involve large amounts of multimedia content and/or documents. Performance evaluation for this use-case involves five different workloads:
- AV: Multimedia content with audio and video files totalling 24.03 GB over 1263 files in 109 sub-folders
- Home: Photos and document files totalling 18.86 GB over 7627 files in 382 sub-folders
- BR: Blu-ray folder structure totalling 23.09 GB over 111 files in 10 sub-folders
- ISOs: OS installation files (ISOs) totalling 28.61 GB over 4 files in one folder
- Disk-to-Disk: Addition of 223.32 GB spread over 171 files in 29 sub-folders to the above four workloads (total of 317.91 GB over 9176 files in 535 sub-folders)
Except for the 'Disk-to-Disk' workload, each data set is first placed in a 29GB RAM drive, and a robocopy command is issue to transfer it to the storage unit formatted in NTFS.
robocopy /NP /MIR /NFL /J /NDL /MT:8 $SRC_PATH $DEST_PATH
Upon completion of the transfer (write test), the contents from the unit are read back into the RAM drive (read test) after a 10 second idling interval. This process is repeated three times for each workload. Read and write speeds, as well as the time taken to complete each pass are recorded. Whenever possible, the temperature of the external storage device is recorded during the idling intervals. Bandwidth for each data set is computed as the average of all three passes.
The 'Disk-to-Disk' workload involves a similar process, but with one iteration only. The data is copied to the external unit from the CPU-attached NVMe drive, and then copied back to the internal drive. It does include more amount of continuous data transfer in a single direction, as data that doesn't fit in the RAM drive is also part of the workload set.
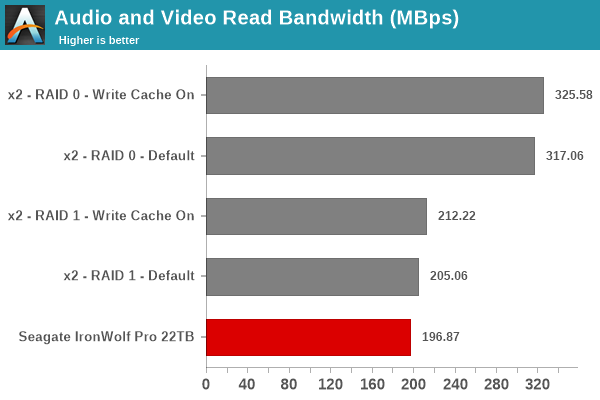
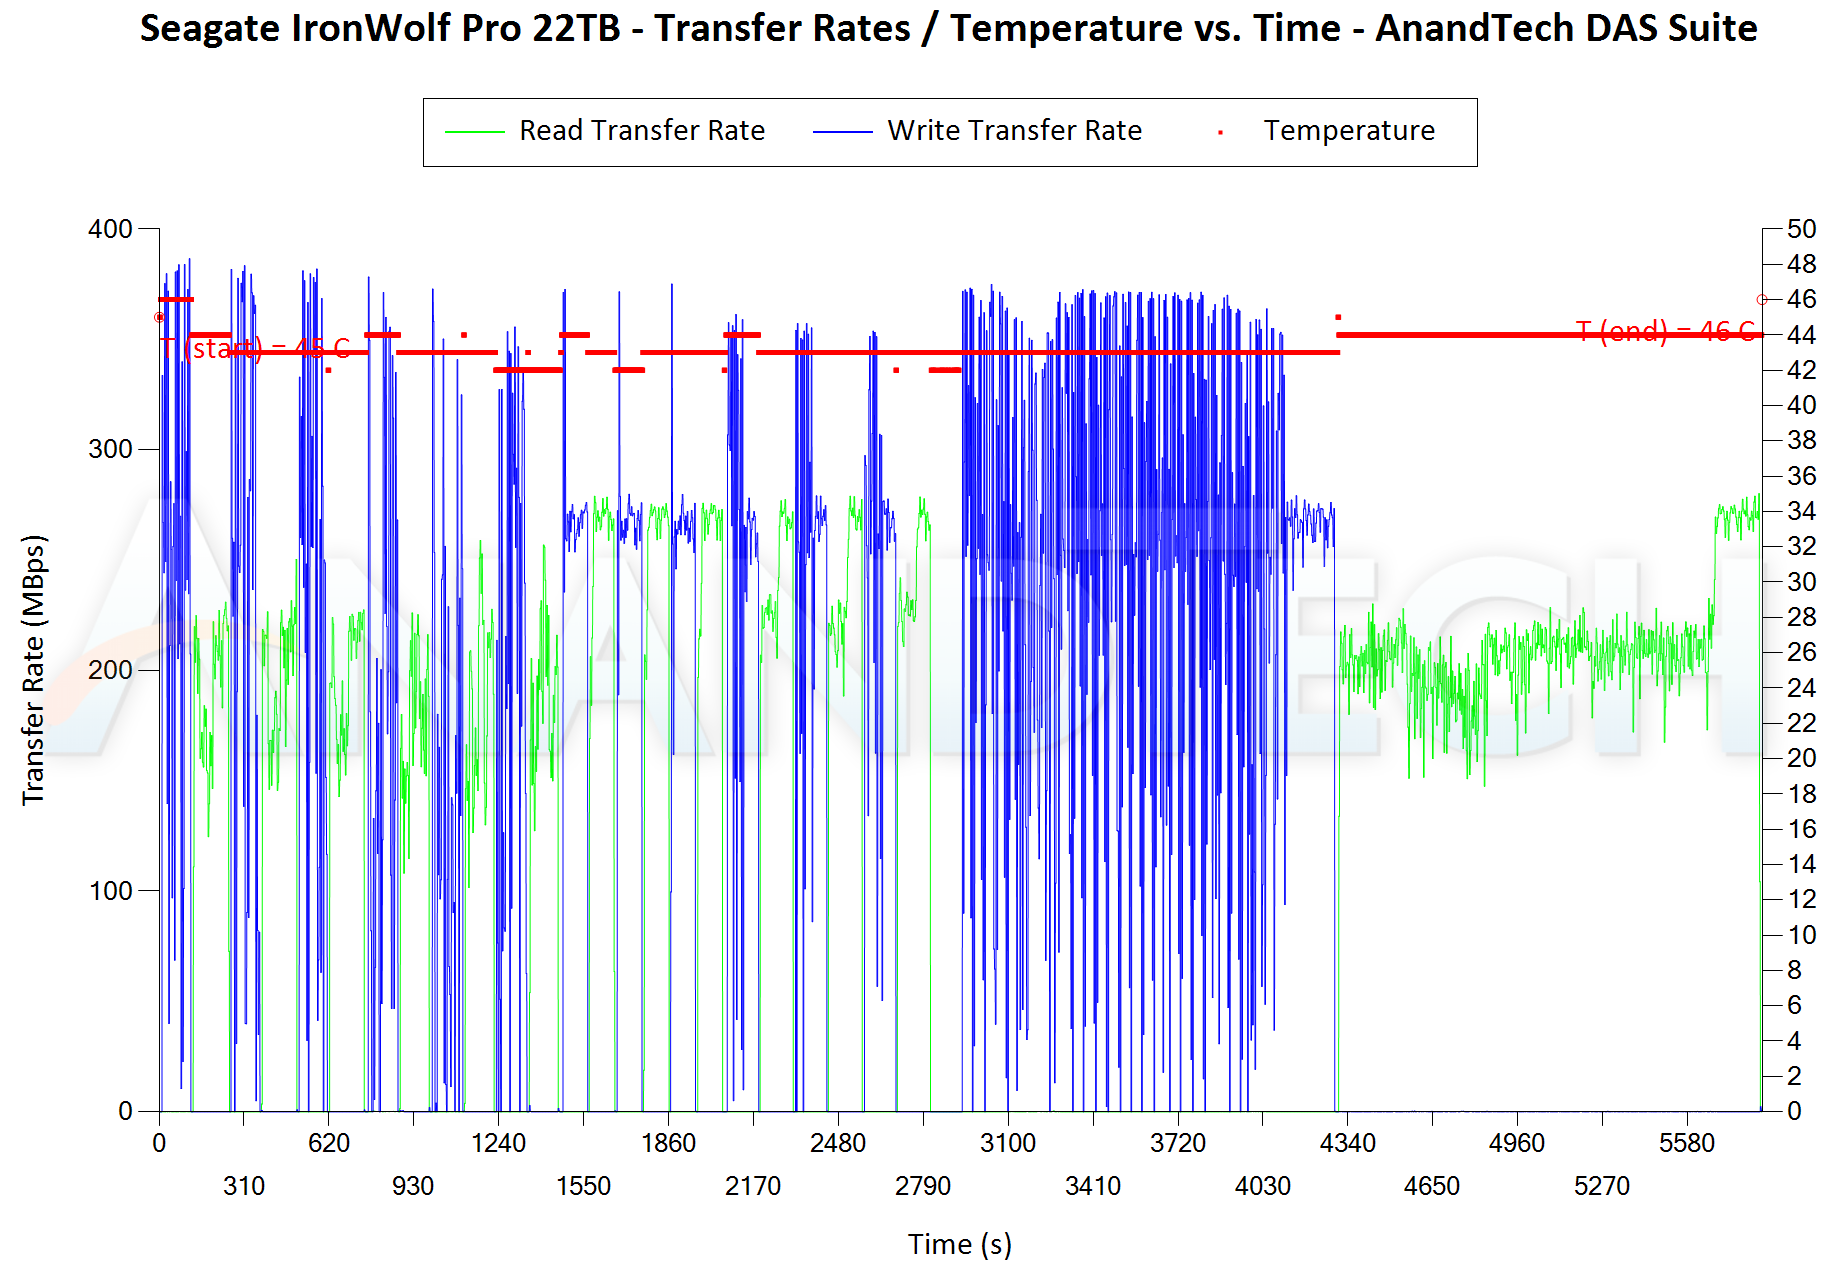
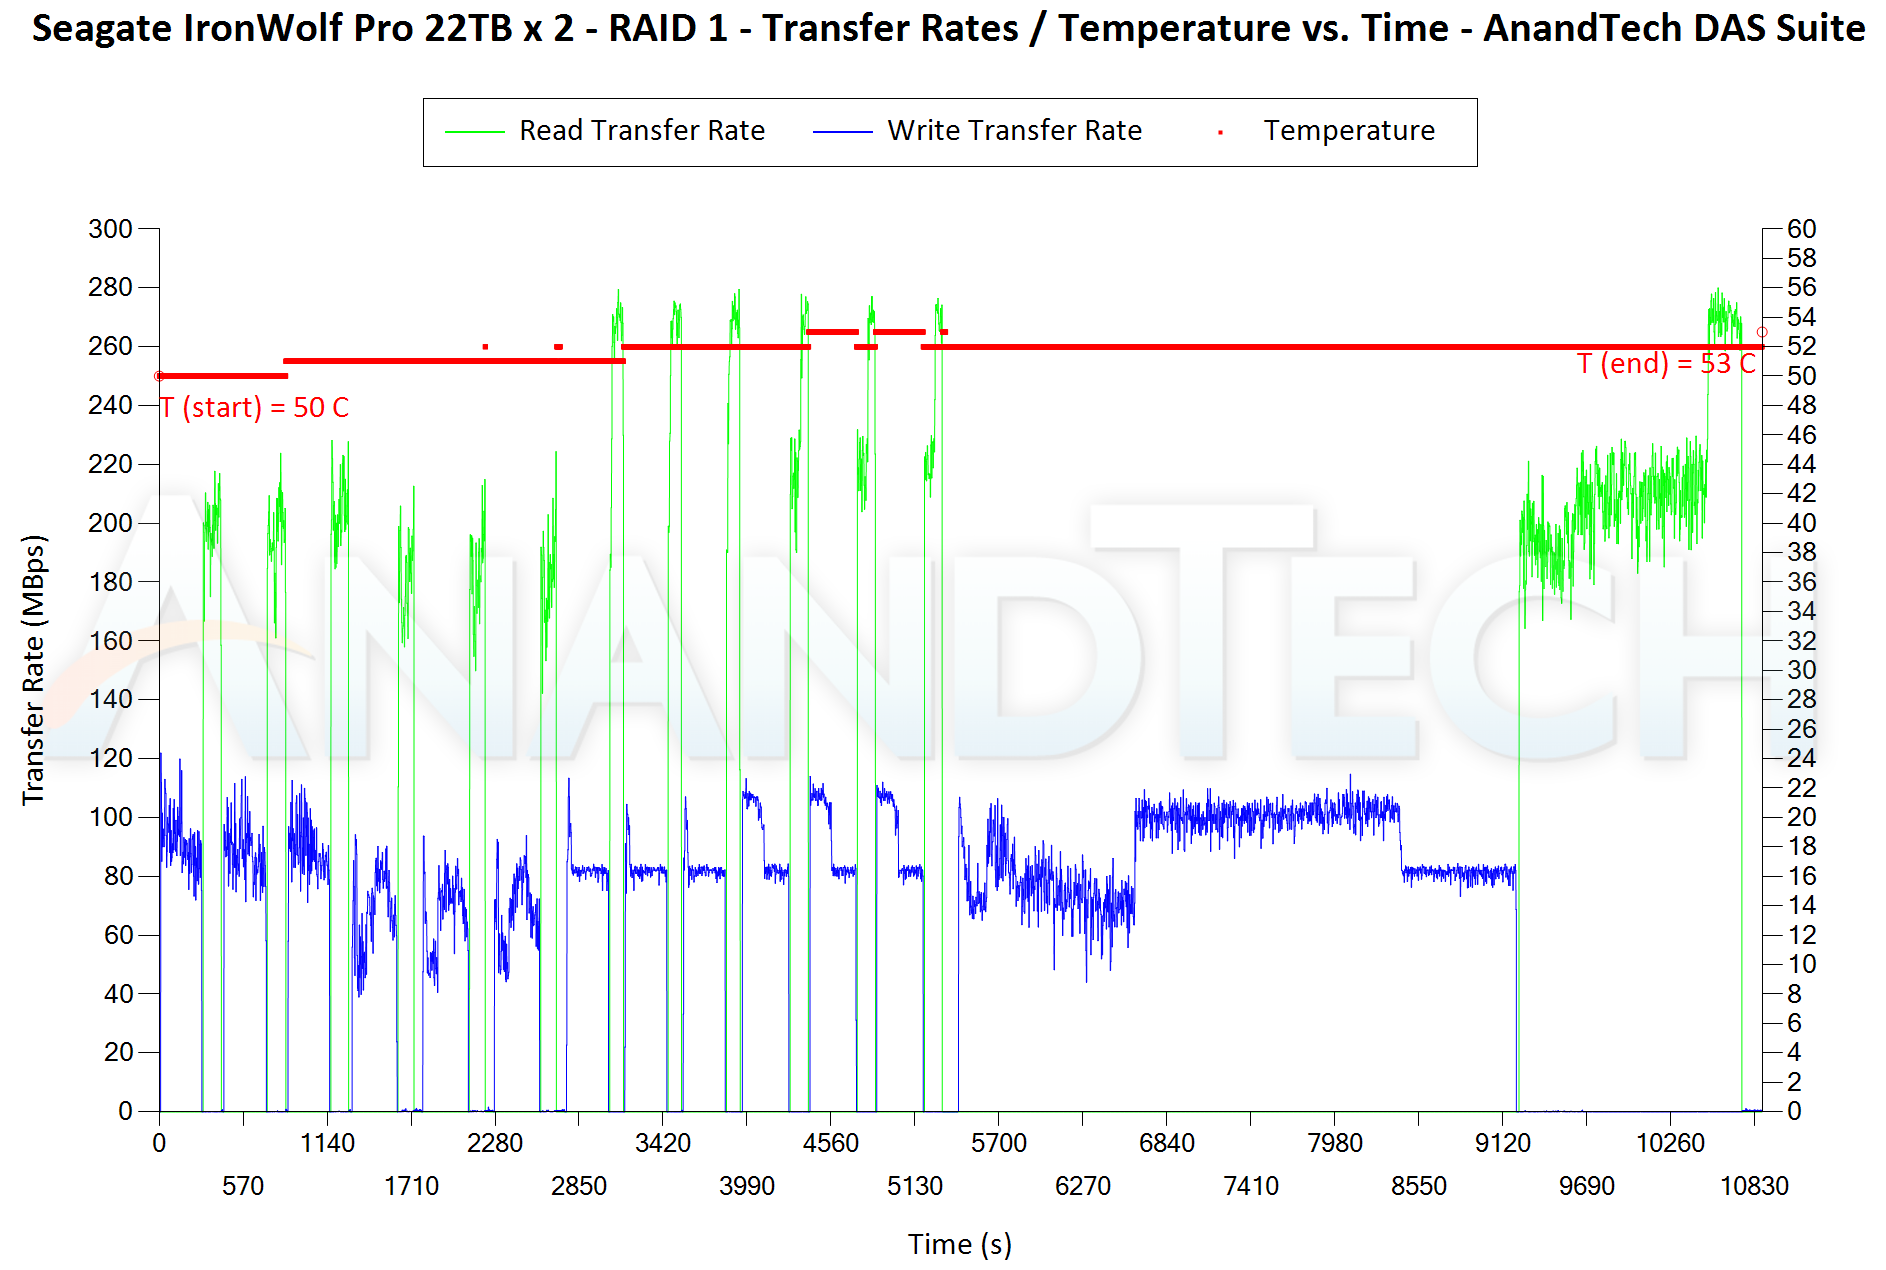
Performance across all the workloads is as per expectations, and is largely dependent on file sizes. For large-sized files, the numbers approach the advertised specifications. RAID0 obviously has an advantage for these sequential workloads, and there is significant gulf for write workloads between the 'write caching on' and 'off' settings.
In addition to tracking the instantaneous read and write speeds of the drive when processing the above workloads, the temperature of the drive was also recorded. The graphs below present the recorded data. For small files, the write speeds (as read periodically from the Windows counters) needs to be smoothened, but the average time for each component has already been recorded in the graphs above.
| File Transfer Workloads - Performance Consistency | |
| TOP: | BOTTOM: |
 |
|
 |
|
Real-World Benchmarking - Application Traces using PCMark 10 Storage Bench
There are a number of storage benchmarks that can subject a device to artificial access traces by varying the mix of reads and writes, the access block sizes, and the queue depth / number of outstanding data requests. We saw results from two popular ones - ATTO, and CrystalDiskMark - in a previous section. More serious benchmarks, however, actually replicate access traces from real-world workloads to determine the suitability of a particular device for a particular workload. Real-world access traces may be used for simulating the behavior of computing activities that are limited by storage performance. Examples include booting an operating system or loading a particular game from the disk.
PCMark 10's storage bench (introduced in v2.1.2153) includes four storage benchmarks that use relevant real-world traces from popular applications and common tasks to fully test the performance of the latest modern drives:
- The Full System Drive Benchmark uses a wide-ranging set of real-world traces from popular applications and common tasks to fully test the performance of the fastest modern drives. It involves a total of 204 GB of write traffic.
- The Quick System Drive Benchmark is a shorter test with a smaller set of less demanding real-world traces. It subjects the device to 23 GB of writes.
- The Data Drive Benchmark is designed to test drives that are used for storing files rather than applications. These typically include NAS drives, USB sticks, memory cards, and other external storage devices. The device is subjected to 15 GB of writes.
- The Drive Performance Consistency Test is a long-running and extremely demanding test with a heavy, continuous load for expert users. In-depth reporting shows how the performance of the drive varies under different conditions. This writes more than 23 TB of data to the drive.
The Full System Drive Benchmark comprises of 23 different traces. For the purpose of presenting results, we classify them under five different categories:
- Boot: Replay of storage access trace recorded while booting Windows 10
- Creative: Replay of storage access traces recorded during the start up and usage of Adobe applications such as Acrobat, After Effects, Illustrator, Premiere Pro, Lightroom, and Photoshop.
- Office: Replay of storage access traces recorded during the usage of Microsoft Office applications such as Excel and Powerpoint.
- Gaming: Replay of storage access traces recorded during the start up of games such as Battlefield V, Call of Duty Black Ops 4, and Overwatch.
- File Transfers: Replay of storage access traces (Write-Only, Read-Write, and Read-Only) recorded during the transfer of data such as ISOs and photographs.
PCMark 10 also generates an overall score, bandwidth, and average latency number for quick comparison of different drives. The sub-sections in the rest of the page reference the access traces specified in the PCMark 10 Technical Guide.
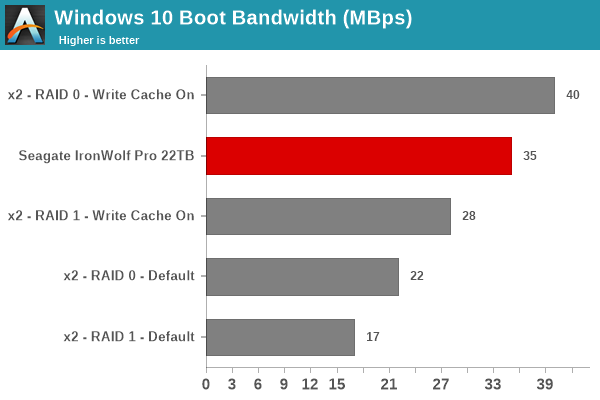
Booting Windows 10
The read-write bandwidth recorded for each drive in the boo access trace is presented below.
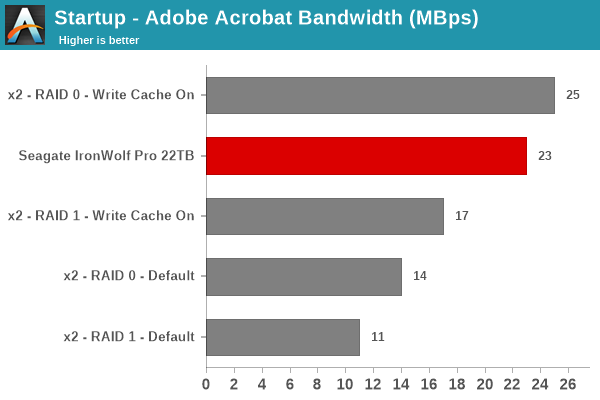
Creative Workloads
The read-write bandwidth recorded for each drive in the sacr, saft, sill, spre, slig, sps, aft, exc, ill, ind, psh, and psl access traces are presented below.
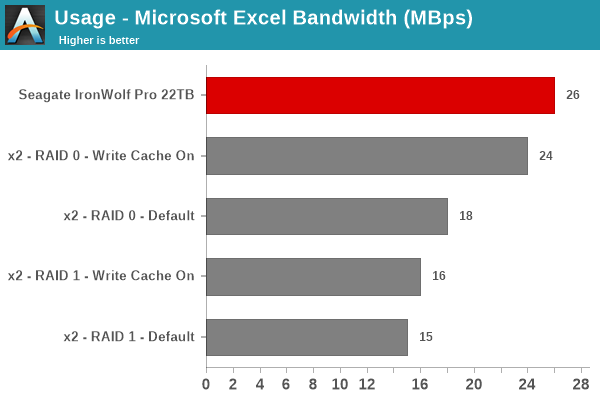
Office Workloads
The read-write bandwidth recorded for each drive in the exc and pow access traces are presented below.
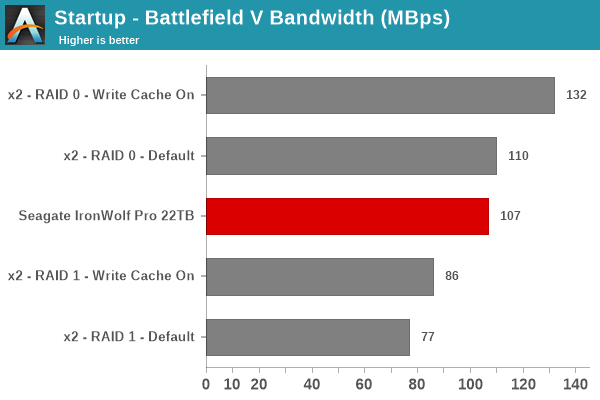
Gaming Workloads
The read-write bandwidth recorded for each drive in the bf, cod, and ow access traces are presented below.
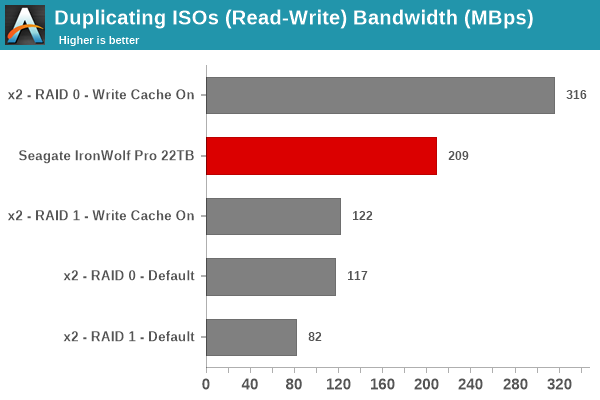
Files Transfer Workloads
The read-write bandwidth recorded for each drive in the cp1, cp2, cp3, cps1, cps2, and cps3 access traces are presented below.
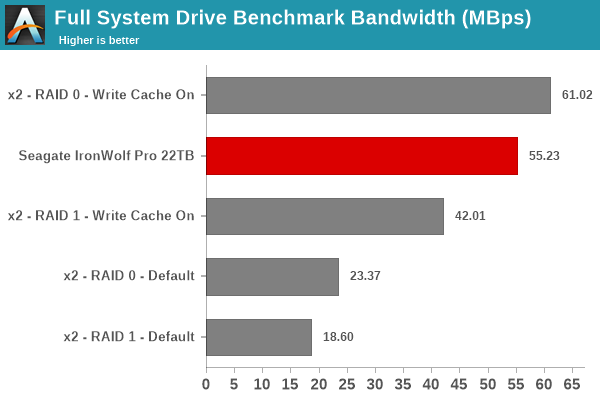
Overall Scores
PCMark 10 reports an overall score based on the observed bandwidth and access times for the full workload set. The score, bandwidth, and average access latency for each of the drives are presented below.
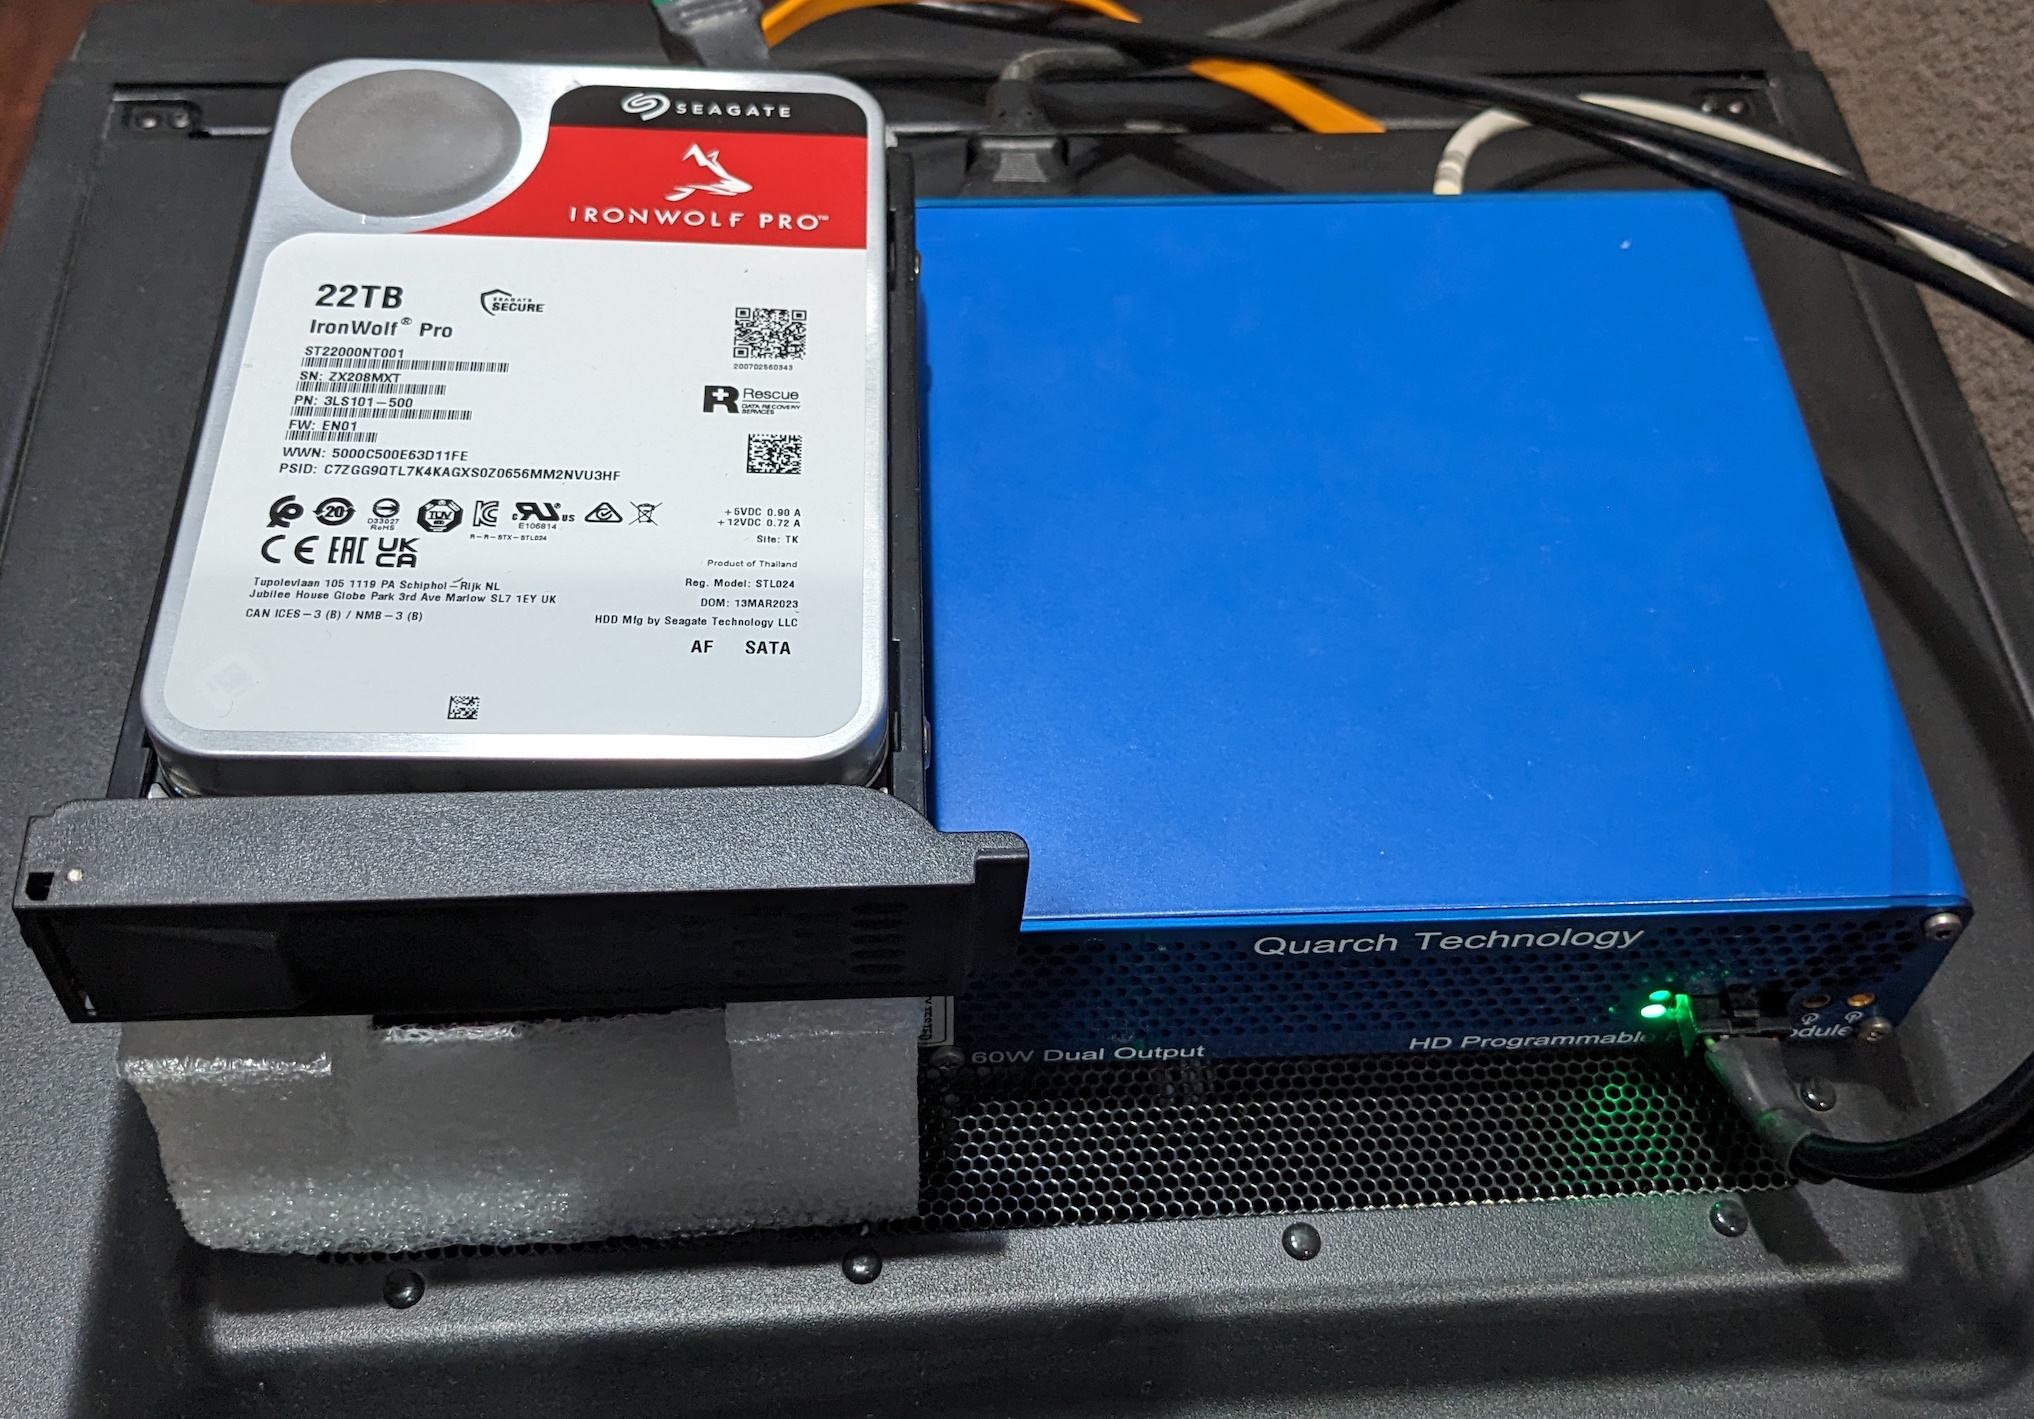
Power Consumption
The power consumption of both the 5V and 12V rails was tracked using Quarch's HD Programmable Power Module with the disk connected to the legacy SATA HDD testbed. The graph below presents the recorded numbers while processing the CrystalDiskMark workload and following it up with 5 minutes of idling.
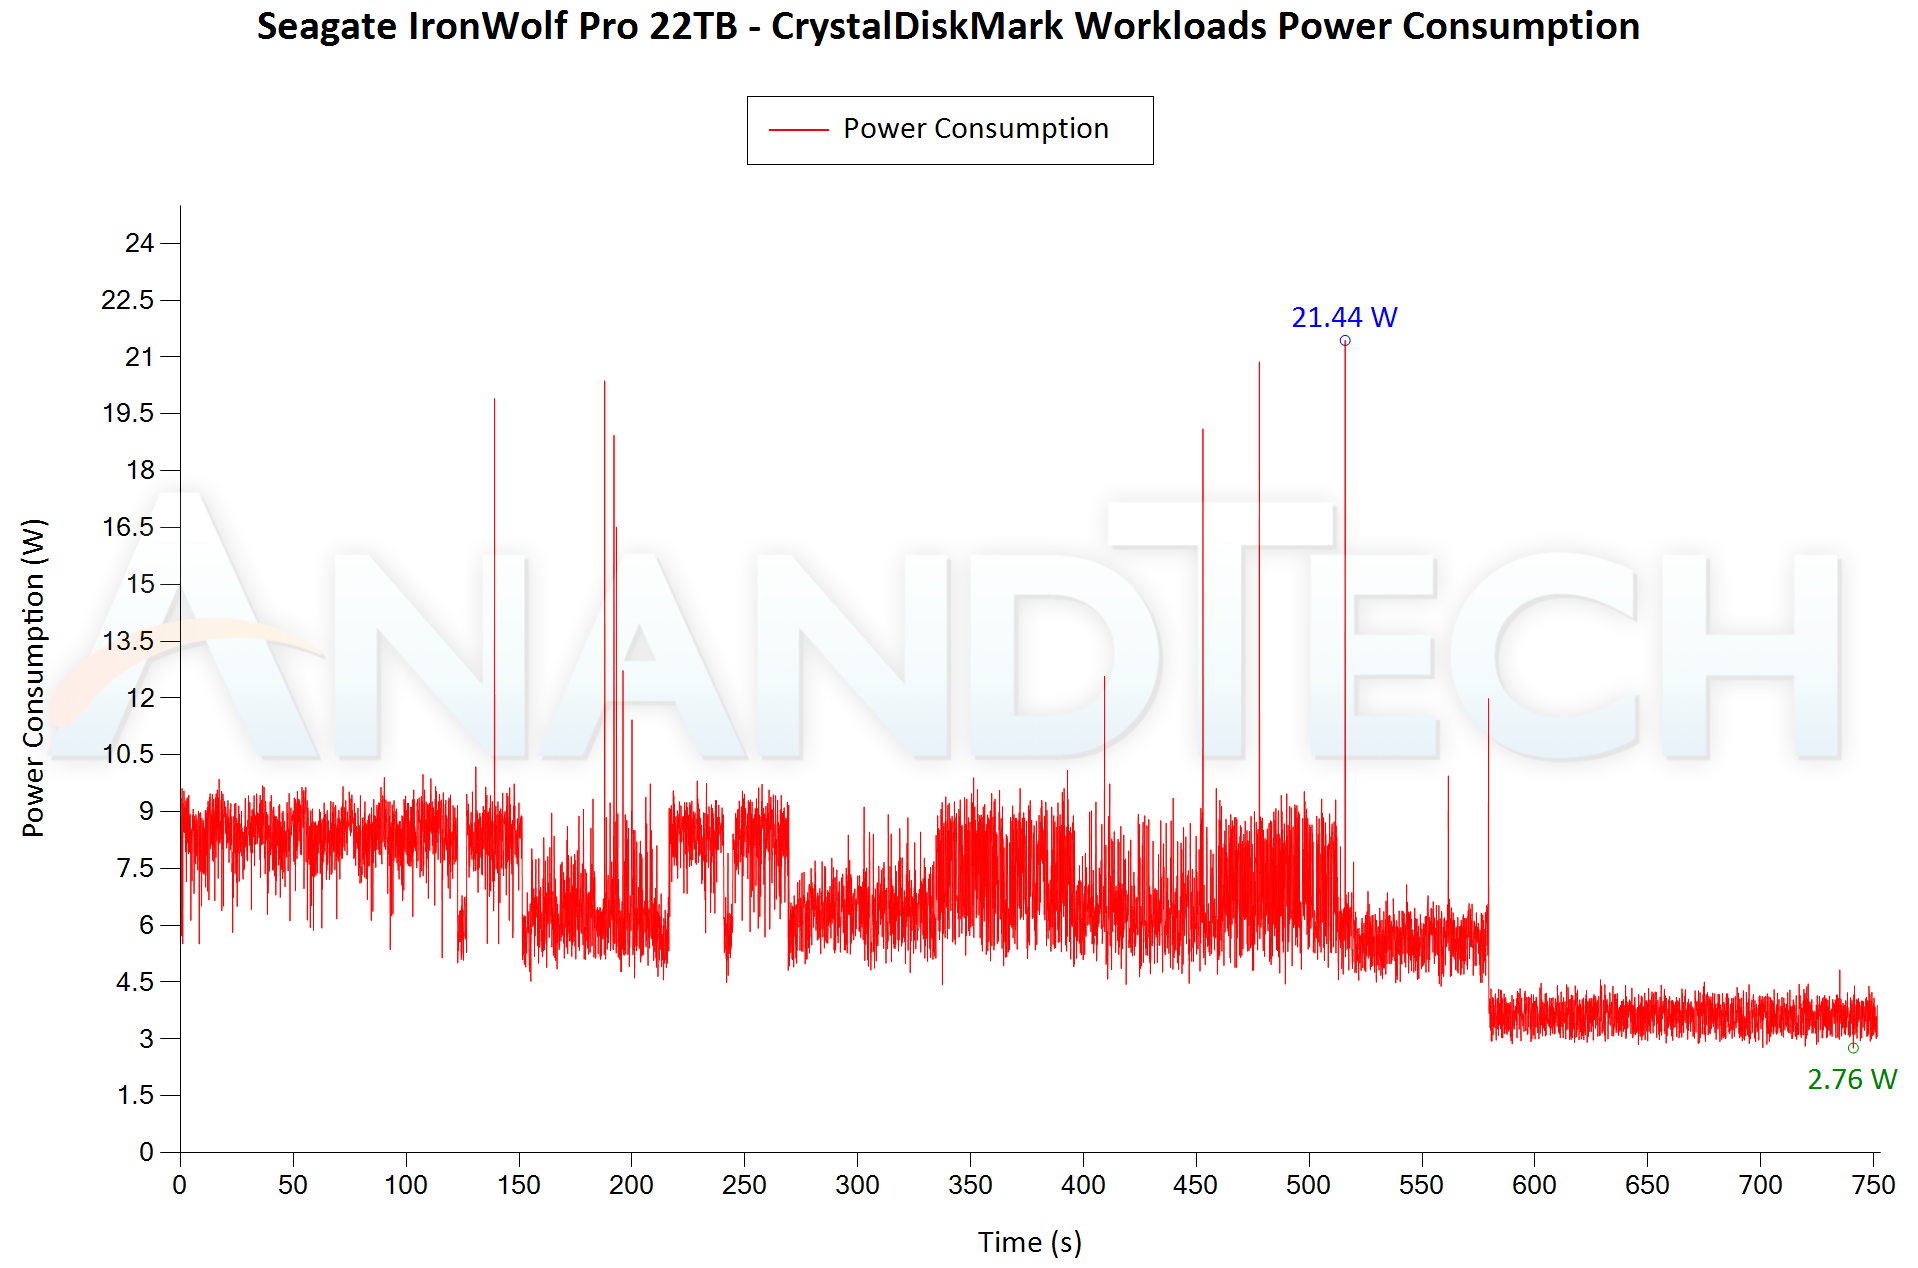
The HDD specs do allow for peak currents of as much as 2A on the 12V rail, and we see that happening. However, for the vast majority of the action, the drive power is around 7W, with the number dropping down to 2.8W under 'idling' conditions. It is possible that the drive enters an even more lower power state after extended idling.
Concluding Remarks
While enterprise data storage requirements have skyrocketed in the last decade or so, the peak capacity increase in HDDs has surpassed the requirements in consumer and SOHO scenarios. When 4TB and 6TB HDDs were the norm, I used to run 8-bay NAS units (still have a couple of those in use) with drives configured in RAID5. Rebuilds were not particularly pleasant. Since then, HDD capacities have increased, but peak speeds have not scaled up (they are not even at the SATA 6 Gbps limit yet). Performing RAID5 / RAID6 rebuilds with 10TB+ HDDs, while praying fervently for another disk in the array to not fail, is best avoided. Thankfully, increased HDD capacities have made it feasible to operate drive arrays in RAID10. For a 4-bay array, RAID5 operation with 10TB HDDs would have yielded 30TB of usable storage with support for a single disk failure (and hoping that one doesn't need to rebuild). With 22TB HDDs, RAID10 operation provides 44TB of usable space with support for dual disk failure (as long as they are not from the same mirrored set). Rebuilds involve copying over data from the other drive in the mirrored set, and do not stress the rest of the drives in the array. It is a different matter that 6+ bays are still useful in home and SOHO scenarios for SSD caching and running other applications (such as VMs) from the SSD volumes.
Currently, the 22TB drives seem to offer the best $/TB metric at higher capacities, particularly after the launch of the 24TB drives (which command a premium, as expected). I had purchased them for $400 each, but the price continues to fluctuate around that mark. Having seen a few reports on various forums about some IronWolf Pro 22TB HDDs being dead-on-arrival and needing to be RMA-ed, I was a bit apprehensive at first. Fortunately, the drives I purchased managed to complete their burn-in process without any hiccups. Performance is nothing to write home about, but I will be configuring them in RAID1 (for now), with plans to shift to RAID10 later.


15 Comments
View All Comments
charlesg - Tuesday, January 2, 2024 - link
UnRaid is your friend.You can have dual disk failures, if configured correctly.
Data is stored on the individual disks in a standalone file system XFS, so in worst case scenario with multi-disk failure, you lose what's on those disks, instead of the entire array.
A wholllle lot less stressful when it comes to rebuilding a disk.
And you get other functionality like docker and VM support, if you want to go there.
I don't work for them. But I use their software, and I couldn't imagine using conventional RAID ever again.
BioHazardous - Tuesday, January 2, 2024 - link
100% agree with you on unRAID. I have an unRAID server with a bunch of random sized HDDs. 2 drive parity set. Actually in the process of taking a 16TB out of the parity pool and adding it to the storage pool by replacing it with a 20TB HDD. Love not having to think too hard about adding more storage to the array. Just had to think a little bit when I ran out of physical space in my tower and had to upgrade to a bigger tower that could hold 16x 3.5" HDDs along with some nice placeholders for 2.5" SSDs behind the motherboard. Anyway, yeah unRAID makes all of this fun and easy.. well aside from the OS being on a thumb drive. I've had to replace the thumb drive from failures a few times now, and no I didn't buy cheap ones.Samus - Wednesday, January 3, 2024 - link
I used Unraid a decade ago and it was kind of crap - it had little customization and not a lot of features like 'snapshots' or selective rebuild. Unraid has come so far since and I have three licenses between my home and my office.Threska - Wednesday, January 3, 2024 - link
Xigma uses ZFS as well.https://xigmanas.com/xnaswp/
charlesg - Wednesday, January 3, 2024 - link
unRAID support ZFS now as well.ballsystemlord - Tuesday, January 2, 2024 - link
You could also try RAID 6. It's what servers use from what I understand. And it's quite robust.awolfe63 - Tuesday, January 2, 2024 - link
RAID 10 does not make any sense in that configuration. RAID 6 will provide the same capacity and can withstand any 2 failures - not just specific pairs. Rebuilds are a rare event. Not losing data is paramount.meacupla - Tuesday, January 2, 2024 - link
How long would it take to rebuild a RAID 6 array made from 22TB drives?Tunnah - Wednesday, January 3, 2024 - link
Some mice built a computer that worked faster..DrReD - Wednesday, January 3, 2024 - link
The rebuild of an array of these 22 TB drives would require about thirty-plus hours, if the system can sustain 200 MB / per-second / per-disk, up to multiples of that, if the disks are slower or the job is disturbed by other workloads, and of course, all is depending on the algorithm too.On a busy array a full —online— rebuild can easily take weeks.