The OnLogic Helix HX500 Review: A Rugged Fanless 35W mini-PC
by Ganesh T S on September 17, 2021 10:00 AM EST- Posted in
- Systems
- Intel
- Fanless
- Industrial PC
- Passive Cooling
- Comet Lake
- OnLogic
UL Benchmarks - PCMark and 3DMark
This section deals with a couple of UL Futuremark benchmarks - PCMark 10 and 3DMark. While PCMark evaluates the system as a whole, 3DMark focuses on the graphics capabilities with emphasis on gaming workloads.
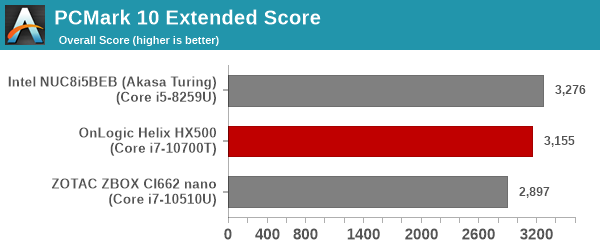
PCMark 10
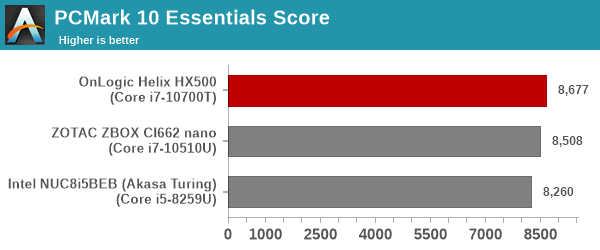
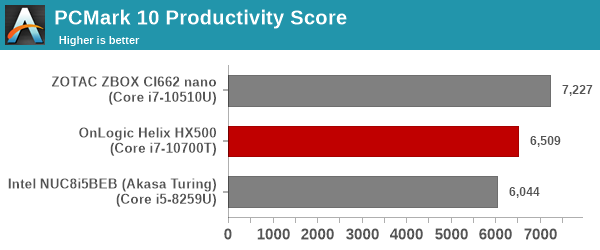
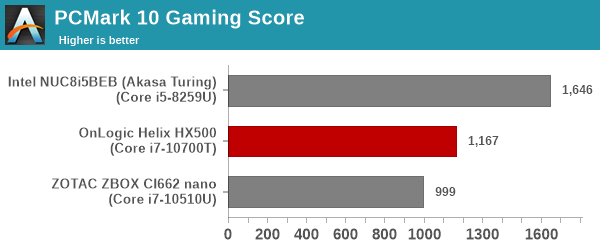
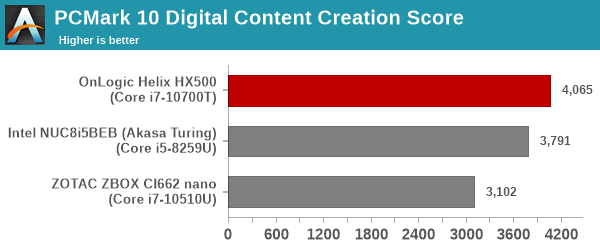
UL's PCMark 10 evaluates computing systems for various usage scenarios (generic / essential tasks such as web browsing and starting up applications, productivity tasks such as editing spreadsheets and documents, gaming, and digital content creation). We benchmarked select PCs with the PCMark 10 Extended profile and recorded the scores for various scenarios. These scores are heavily influenced by the CPU and GPU in the system, though the RAM and storage device also play a part. The power plan was set to Balanced for all the PCs while processing the PCMark 10 benchmark.
3DMark
UL's 3DMark comes with a diverse set of graphics workloads that target different Direct3D feature levels. Correspondingly, the rendering resolutions are also different. We use 3DMark 2.4.4264 to get an idea of the graphics capabilities of the system. In this section, we take a look at the performance of the OnLogic Helix HX500 across the different 3DMark workloads.
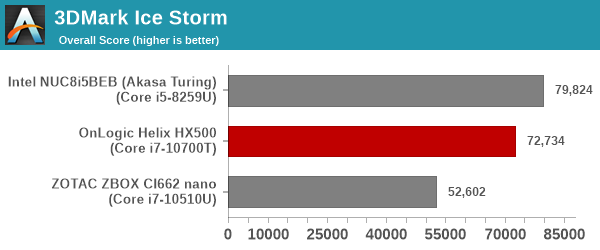
3DMark Ice Storm
This workload has three levels of varying complexity - the vanilla Ice Storm, Ice Storm Unlimited, and Ice Storm Extreme. It is a cross-platform benchmark (which means that the scores can be compared across different tablets and smartphones as well). All three use DirectX 11 (feature level 9) / OpenGL ES 2.0. While the Extreme renders at 1920 x 1080, the other two render at 1280 x 720. The graphs below present the various Ice Storm worloads' numbers for different systems that we have evaluated.
| UL 3DMark - Ice Storm Workloads | |||
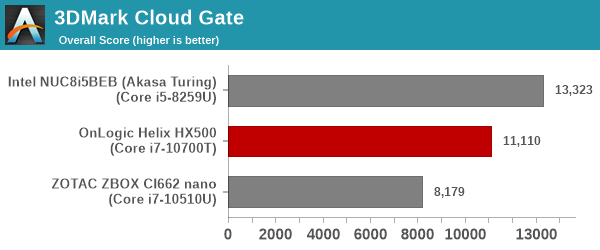
3DMark Cloud Gate
The Cloud Gate workload is meant for notebooks and typical home PCs, and uses DirectX 11 (feature level 10) to render frames at 1280 x 720. The graph below presents the overall score for the workload across all the systems that are being compared.
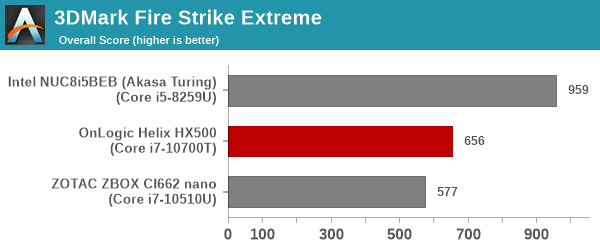
3DMark Fire Strike
The Fire Strike benchmark has three workloads. The base version is meant for high-performance gaming PCs. Similar to Sky Diver, it uses DirectX 11 (feature level 11) to render frames at 1920 x 1080. The Extreme version targets 1440p gaming requirements, while the Ultra version targets 4K gaming system, and renders at 3840 x 2160. The graph below presents the overall score for the Fire Strike Extreme and Fire Strike Ultra benchmark across all the systems that are being compared.
| UL 3DMark - Fire Strike Workloads | |||
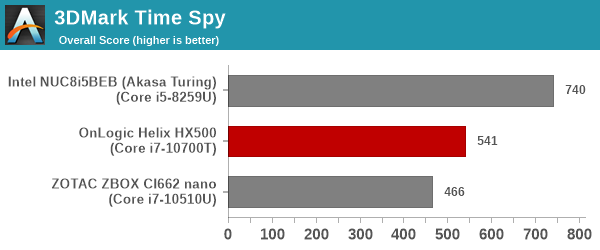
3DMark Time Spy
The Time Spy workload has two levels with different complexities. Both use DirectX 12 (feature level 11). However, the plain version targets high-performance gaming PCs with a 2560 x 1440 render resolution, while the Extreme version renders at 3840 x 2160 resolution. The graphs below present both numbers for all the systems that are being compared in this review.
| UL 3DMark - Time Spy Workloads | |||
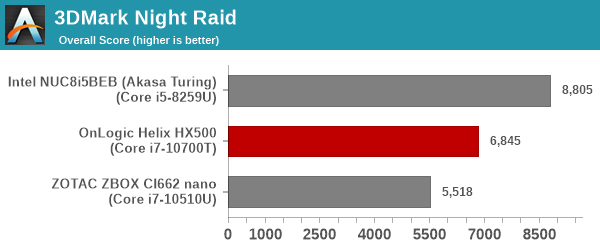
3DMark Night Raid
The Night Raid workload is a DirectX 12 benchmark test. It is less demanding than Time Spy, and is optimized for integrated graphics. The graph below presents the overall score in this workload for different system configurations.
3DMark CPU Profile Benchmark
UL recently introduced a benchmark to test the multi-threaded capabilities of the CPU in a system. Since gaming workloads are often multi-threaded, it makes sense to include this testing as part of the 3DMark suite. The benchmark routine attempts to perform the simulation of birds / bird-like objects flocking together using as many advanced capabilities as offered by the processor. The workload is configured to run with different number of threads ranging from 1 to 16 (and a single entry for the maximum number of threads allowed in the system).
| UL 3DMark - CPU Profile Benchmark | |||
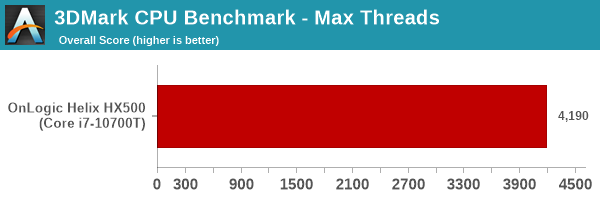
We present the benchmark results for the single and maximum threads case above.
For graphics workloads, the Intel UHD Graphics 630 is quite weak even when compared against the one in the Bean Canyon NUC (a 28W TDP processor cooled with the Akasa Turing fanless chassis). For CPU workloads, the HX500 manages to inch ahead, thanks to the presence of additional cores and slightly higher power budget.


32 Comments
View All Comments
nandnandnand - Tuesday, September 21, 2021 - link
I really love the AnandTech comment system. Instead of checking for notifications, I can check the comment counts on the stories, remember the old number to see if it has gone up at all, and then skim... only to find a new spam comment.t.s - Tuesday, September 28, 2021 - link
One of the most prominent tech news site, with abysmal comment system. Nice.