The Inland Performance Plus 2TB SSD Review: Phison's E18 NVMe Controller Tested
by Billy Tallis on May 13, 2021 8:00 AM ESTMixed IO Performance
For details on our mixed IO tests, please see the overview of our 2021 Consumer SSD Benchmark Suite.
 |
|||||||||
| Mixed Random IO | Throughput | Power | Efficiency | ||||||
| Mixed Sequential IO | Throughput | Power | Efficiency | ||||||
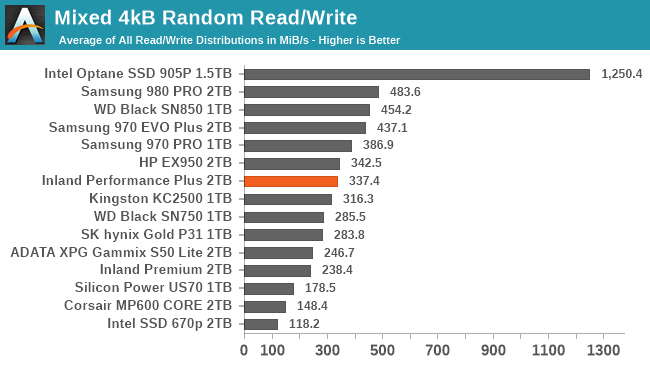
The Inland Performance Plus with the Phison E18 controller sets a new record for performance on our mixed sequential IO test, and it provides pretty good power efficiency on that test. It has somewhat disappointing performance on the mixed random IO test, with a few Gen3 TLC drives delivering better performance, and most of the 8-channel TLC drives delivering better efficiency.
 |
|||||||||
| Mixed Random IO | |||||||||
| Mixed Sequential IO | |||||||||
On the sequential IO test, the Inland Performance Plus is a bit slow to start when the workload is very read-heavy, but quickly ramps up to about 6GB/s. Like many drives, performance is low to begin with as these drives aren't exactly optimized for juggling several parallel streams of sequential reads. Once the workload has shifted to include a significant amount of writes, caching makes things easier for the drives to manage and performance tends to improve. The E18 controller makes that transition early and with as big a performance gain as any drive, and things hold relatively steady around 6GB/s through the rest of the test.
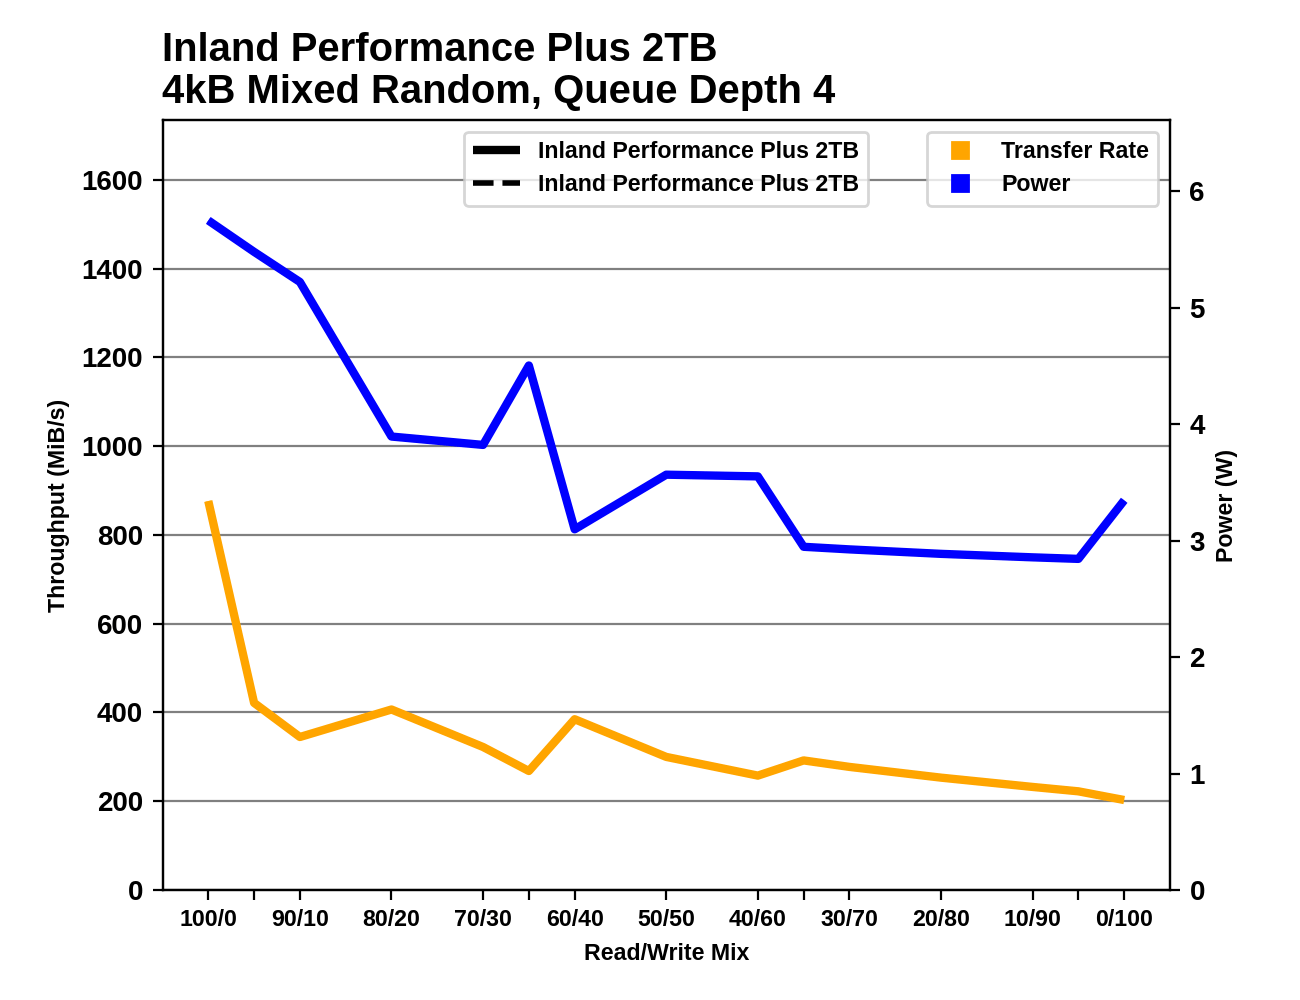
On the random IO test, the Performance Plus is less consistent. After the typical initial performance drop that comes from adding the first bit of writes to the mix, the Performance Plus generally keeps slowing down but there's quite a bit of variability. The higher power consumption during phases where performance is lower indicates that there's background work to clean up the SLC cache interfering with benchmark performance. Things settle down during the last third of the test.
Power Management Features
Real-world client storage workloads leave SSDs idle most of the time, so the active power measurements presented earlier in this review only account for a small part of what determines a drive's suitability for battery-powered use. Especially under light use, the power efficiency of a SSD is determined mostly be how well it can save power when idle.
For many NVMe SSDs, the closely related matter of thermal management can also be important. M.2 SSDs can concentrate a lot of power in a very small space. They may also be used in locations with high ambient temperatures and poor cooling, such as tucked under a GPU on a desktop motherboard, or in a poorly-ventilated notebook.
| Inland Performance Plus 2TB NVMe Power and Thermal Management Features |
|||
| Controller | Phison E18 | ||
| Firmware | EIFM21.1 | ||
| NVMe Version |
Feature | Status | |
| 1.0 | Number of operational (active) power states | 3 | |
| 1.1 | Number of non-operational (idle) power states | 2 | |
| Autonomous Power State Transition (APST) | Supported | ||
| 1.2 | Warning Temperature | 70 °C | |
| Critical Temperature | 110 °C | ||
| 1.3 | Host Controlled Thermal Management | Supported | |
| Non-Operational Power State Permissive Mode | Supported | ||
The Phison E18 as used in the Inland Performance Plus supports the full range of NVMe power and thermal management features, but with the somewhat implausible 110 °C critical temperature threshold. The deepest idle power state also claims only a 30% reduction in power at the cost of much higher entry and exit latencies. Fortunately, as shown below the lowest idle power state saves a lot more power than indicated by this firmware information.
| Inland Performance Plus 2TB NVMe Power States |
|||||
| Controller | Phison E18 | ||||
| Firmware | EIFM21.1 | ||||
| Power State |
Maximum Power |
Active/Idle | Entry Latency |
Exit Latency |
|
| PS 0 | 8.8 W | Active | - | - | |
| PS 1 | 7.1 W | Active | - | - | |
| PS 2 | 5.2 W | Active | - | - | |
| PS 3 | 62 mW | Idle | 2 ms | 2 ms | |
| PS 4 | 44 mW | Idle | 25 ms | 25 ms | |
Note that the above tables reflect only the information provided by the drive to the OS. The power and latency numbers are often very conservative estimates, but they are what the OS uses to determine which idle states to use and how long to wait before dropping to a deeper idle state.
Idle Power Measurement
SATA SSDs are tested with SATA link power management disabled to measure their active idle power draw, and with it enabled for the deeper idle power consumption score and the idle wake-up latency test. Our testbed, like any ordinary desktop system, cannot trigger the deepest DevSleep idle state.
Idle power management for NVMe SSDs is far more complicated than for SATA SSDs. NVMe SSDs can support several different idle power states, and through the Autonomous Power State Transition (APST) feature the operating system can set a drive's policy for when to drop down to a lower power state. There is typically a tradeoff in that lower-power states take longer to enter and wake up from, so the choice about what power states to use may differ for desktop and notebooks, and depending on which NVMe driver is in use. Additionally, there are multiple degrees of PCIe link power savings possible through Active State Power Management (APSM).
We report three idle power measurements. Active idle is representative of a typical desktop, where none of the advanced PCIe link or NVMe power saving features are enabled and the drive is immediately ready to process new commands. Our Desktop Idle number represents what can usually be expected from a desktop system that is configured to enable SATA link power management, PCIe ASPM and NVMe APST, but where the lowest PCIe L1.2 link power states are not available. The Laptop Idle number represents the maximum power savings possible with all the NVMe and PCIe power management features in use—usually the default for a battery-powered system but rarely achievable on a desktop even after changing BIOS and OS settings. Since we don't have a way to enable SATA DevSleep on any of our testbeds, SATA drives are omitted from the Laptop Idle charts.
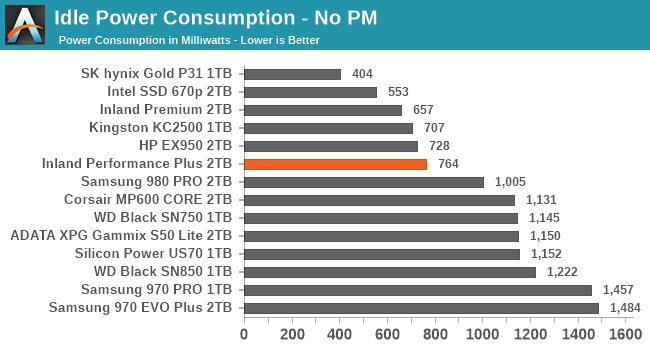
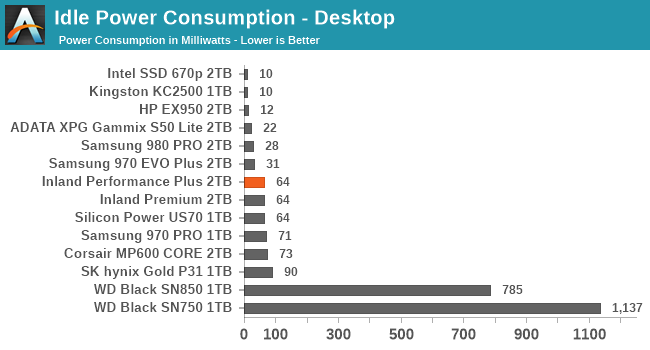
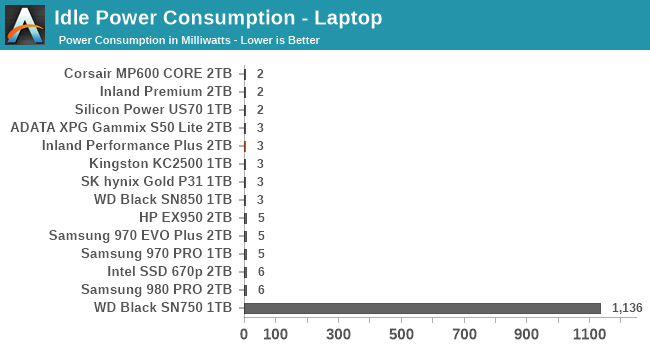
The active idle power from the E18 drive is well under 1W, a clear improvement over other Gen4 drives and many of the top-performing Gen3 drives (note: all Gen4 drives are operating at Gen3 speeds during this test, because we can't get idle power management working properly on our Gen4 testbeds; on a Gen4 system we expect active idle power to be a bit higher). The desktop idle almost exactly matches what the drive claims, and lowest laptop idle power is great at just 3mW.
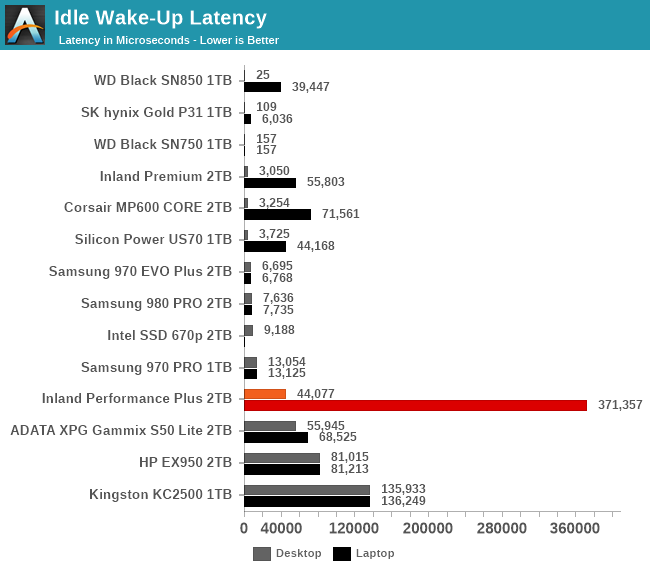
Unfortunately, wake-up times are a bit slow: wake-up from the desktop idle state is already 44ms and wake-up from the laptop idle state is a whopping 371ms, which is enough to cause noticeable delays if this power state is used frequently by the OS.


118 Comments
View All Comments
RSAUser - Friday, May 14, 2021 - link
Even then, storage is substantially cheaper than RAM, but it will be interesting to see if e.g. 64-128GB RAM configs will become a more common thing (since 64GB/memory die on DDR5 vs 16GB/die on DDR4).oRAirwolf - Thursday, May 13, 2021 - link
Great article as always. I do wish Anandtech would add some real world performance numbers like Windows load times, game load times, file transfer speeds, etc.jospoortvliet - Friday, May 14, 2021 - link
That is exactly what the trace tests on page 2 are.Spunjji - Friday, May 14, 2021 - link
Those kind of tests aren't going to show any noticeable differences. I'm saying this as someone who has personally messed around with configurations like having 6 SATA 3 SSDs in RAID-0, various flavours of NVMe, etc.mode_13h - Saturday, May 15, 2021 - link
> having 6 SATA 3 SSDs in RAID-0Depends on your controller and how it's connected. I have a fileserver with 3x SATA SSDs in a RAID-5, and my bottleneck is the DMI link.
Spunjji - Monday, May 17, 2021 - link
Sort-of, and sort-of not - you'll get lower performance on devices connected over a chipset link than directly, but in terms of Windows and game load times you're rarely going to see more than single-second differences.For the record, my 6-drive array was connected directly to the CPU via a PCIe 3.0 8x RAID card. It would be handily outperformed by a modern ~1TB NVMe drive, and the RAID BIOS initialization time easily eclipsed the minor difference it made to Windows load times over a single drive. I didn't keep it around for long - it was just a thing I tried because I ended up with a bunch of 256GB SATA SSDs and some spare time.
edzieba - Monday, May 17, 2021 - link
I'd love to see the recent crop of "New Faster PCIe 4.0!" drives be tested on both PCIe 4.0 and PCIe 3.0 (on the same system, just with the bus capped) to control for meaningful improvements i ndrive controller performance vs. meaning improvements from link rate increase.I suspect that the majority of performance gain from new drives is down to using newer controllers, and those without PCIe 4.0 capable boards would see near identical performance.
KarlKastor - Tuesday, May 18, 2021 - link
@Billy TallisCan you please write the NAND manufacturer in the lists? You just write the No of Layers. The difference between Toshiba and Micron NAND were sometimes quite huge in the past.