GIGABYTE GA-J1800N-D2H Review: Dual Core Bay Trail-D at $69
by Ian Cutress on December 26, 2014 11:00 AM EST- Posted in
- Motherboards
- Intel
- Bay Trail
Integrated Gaming Performance
F1 2013
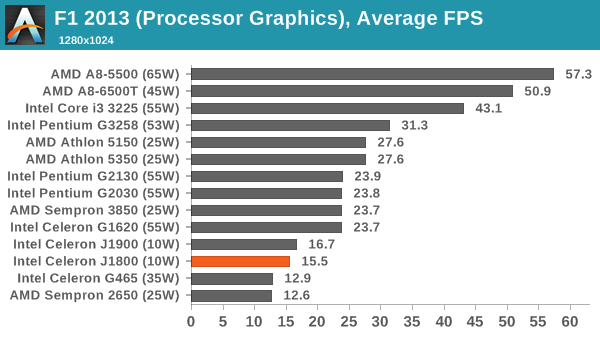
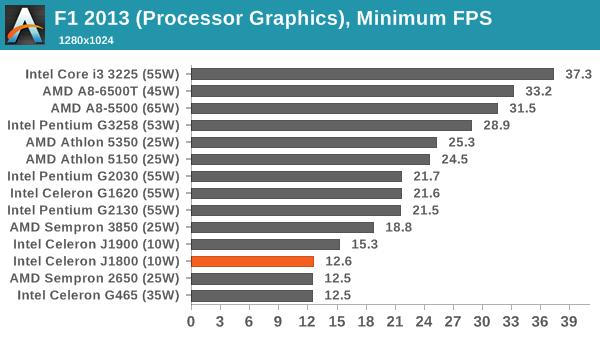
First up is F1 2013 by Codemasters. I am a big Formula 1 fan in my spare time, and nothing makes me happier than carving up the field in a Caterham, waving to the Red Bulls as I drive by (because I play on easy and take shortcuts). F1 2013 uses the EGO Engine, and like other Codemasters games ends up being very playable on old hardware quite easily. In order to beef up the benchmark a bit, we devised the following scenario for the benchmark mode: one lap of Spa-Francorchamps in the heavy wet, the benchmark follows Jenson Button in the McLaren who starts on the grid in 22nd place, with the field made up of 11 Williams cars, 5 Marussia and 5 Caterham in that order. This puts emphasis on the CPU to handle the AI in the wet, and allows for a good amount of overtaking during the automated benchmark. For our integrated test we run at 1280x1024 on Low graphical settings.
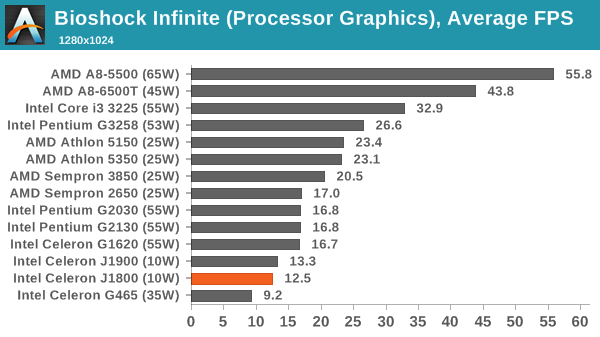
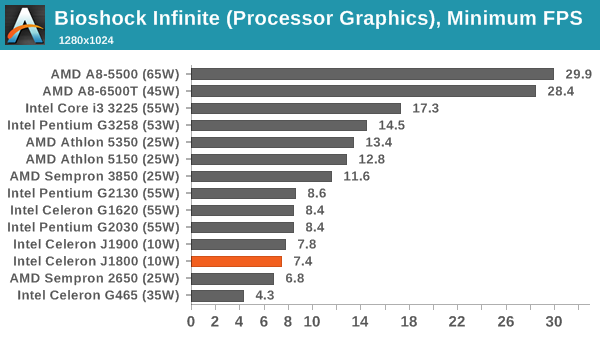
Bioshock Infinite
Bioshock Infinite was Zero Punctuation’s Game of the Year for 2013, uses the Unreal Engine 3, and is designed to scale with both cores and graphical prowess. We test the benchmark using the Adrenaline benchmark tool and the Performance (1280x1024, Low) setting, noting down the average frame rates and the minimum frame rates.

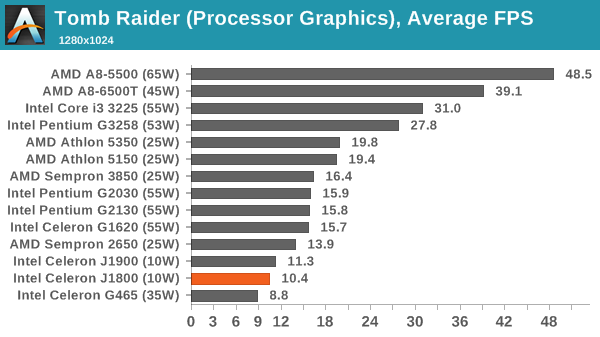
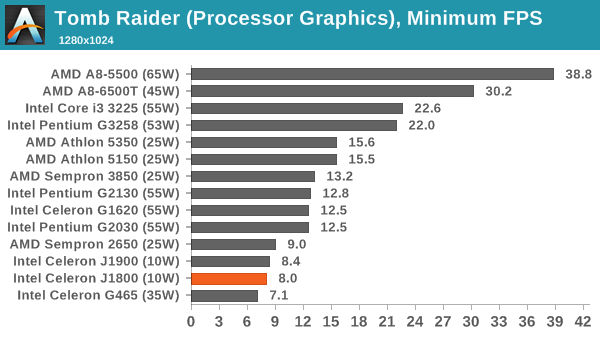
Tomb Raider
The next benchmark in our test is Tomb Raider. Tomb Raider is an AMD optimized game, lauded for its use of TressFX creating dynamic hair to increase the immersion in game. Tomb Raider uses a modified version of the Crystal Engine, and enjoys raw horsepower. We test the benchmark using the Adrenaline benchmark tool and the Performance (1280x1024, Low) setting, noting down the average frame rates and the minimum frame rates.

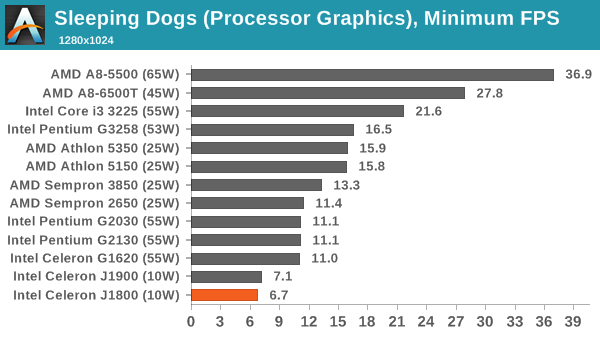
Sleeping Dogs
Sleeping Dogs is a benchmarking wet dream – a highly complex benchmark that can bring the toughest setup and high resolutions down into single figures. Having an extreme SSAO setting can do that, but at the right settings Sleeping Dogs is highly playable and enjoyable. We run the basic benchmark program laid out in the Adrenaline benchmark tool, at the Performance (1280x1024, Low) setting, noting down the average frame rates and the minimum frame rates.


38 Comments
View All Comments
jbltecnicspro - Saturday, December 27, 2014 - link
Good article, but I really would have appreciated if you could compare this CPU to a Celeron 1037u. I have a feeling that with its Ivy Bridge architecture though, that it would probably wipe the floor with this new CPU.bill.rookard - Saturday, December 27, 2014 - link
You'd be right on the dual core version. Compared against the little quad core version, the quad does significantly better. I have to say that I wouldn't consider the dual core for any purchase, but I do have the quad in my htpc. The quad has slower single thread performance, but the total score (geekbench) using all cores matches the 1037u.jbltecnicspro - Saturday, December 27, 2014 - link
Interesting. Thanks for sharing your experiences. I have to wonder though, when I see a 1037u + motherboard system for sale for like $4 extra dollars, what's Intel's point in releasing this? I suppose eventually when the supply for the 1037u dries up, all we'll have are these Atoms. Hurray - we're paying more for less. :)bill.rookard - Saturday, December 27, 2014 - link
Well, I do agree on some puzzlement as to what purpose the J1800 serves. The J1800 is a 10w part, the J1900 is a 10w part. Geekbench on the J1800 is about 1000 on the single core (matching the J1900) but only 1600 on the multicore score. That is pretty useless and would be somewhat painful to use in real life.And - considering that the J1900 scores much higher on the multi-core loads while operating in the same thermal envelope, they can't even say that it's really and issue of power usage in a mobile situation. So, I can see why they would release the J1900 quad, it turns in similar performance metrics as the 1037u while using half the power which is a worthwhile cause.
The J1800 seems to be a 'broken quad core' part that they're releasing to keep yields high as they sell them to suckers who don't realize how slow they are.
nginx - Friday, January 2, 2015 - link
There would have been a huge market for these if they had the intuition to slot in a couple of extra SATA ports. It would have made for a super cheap 4 bay NAS with extremely low power consumption. Would have easily been the next gen successor to the 1037u for the DIY NAS builders.In its current state, it might only appeal to the HTPC builders if it can do transconding on the fly. For those of us who don't need transcoding on the fly, the Raspberry Pi is the perfect solution.
A secondary market could be those looking for a PC just to surf the net and do light office work but with a score of 1000, even those tasks could be a handful for the J1800. I have a 7 year old Core2Duo laptop with 1083 score and it feels too sluggish for daily use even with an SSD.
flensr - Saturday, December 27, 2014 - link
the price link to the dell monitor goes to the amazon search for the viewsonic monitor.eanazag - Tuesday, January 13, 2015 - link
Okay, so are you using UEFI in Windows 7? This obviously affects POST time. Also Windows 8 POST times with UEFI would be the best case scenario in testing. If I care about POST times, I will be running Windows 8.I remember that there have been benches done with Anandtech on Windows 8. Why not across the board?