The iPad Air Review
by Anand Lal Shimpi on October 29, 2013 9:00 PM ESTGPU Performance
Since the iPad Air uses the same A7 silicon as the iPhone 5s, it also uses the same on-die GPU as the 5s: IMG’s PowerVR G6430. This is a 4-cluster configuration of IMG’s latest graphics hardware, running at some relatively high frequency. I already went into some detail on the G6430 in our 5s review so I won’t rehash that here, but we’re basically looking at a shift to a more efficient scalar architecture.
I still don’t have confirmations of clock speeds, but I believe we’re looking at a max GPU clock of around 450MHz. As you’ll see from the results below, there’s a small difference in performance between the iPad Air and iPhone 5s in terms of peak GPU performance - implying very similar clocks. The difference is the iPad Air should be able to sustain its max frequency longer than the iPhone 5s can.
| Mobile SoC GPU Comparison | ||||||||||||
| PowerVR SGX 554MP4 | PowerVR G6430 | PowerVR G6430 | ||||||||||
| Used In | iPad 4 | iPhone 5s | iPad Air | |||||||||
| SIMD Name | USSE2 | USC | USC | |||||||||
| # of SIMDs | 32 | 4 | 4 | |||||||||
| MADs per SIMD | 4 | 32 | 32 | |||||||||
| Total MADs | 128 | 128 | 128 | |||||||||
| GFLOPS @ 300MHz | 76.8 GFLOPS | 76.8 GFLOPS | 76.8 GFLOPS | |||||||||
| GFLOPS as Shipping | 68.1 GFLOPS (?) | 115.2 GFLOPS | 115.2 GFLOPS | |||||||||
Since we’re talking about an A7 here and not an X-series SoC, there’s still only a 64-bit wide memory interface. As memory bandwidth is a key enabler of GPU performance I was curious to see how GPU performance compared to the outgoing iPad 4 with its much wider memory interface. Do keep in mind that the A7 does include a large system cache on-die, which can help improve effective memory bandwidth.
GFXBench 2.7
We'll start our GPU performance analysis with a look at low level results using GFXBench/GLBenchmark 2.7. The low level tests, particularly the offscreen ones, should give us some idea as to whether or not there's any increase in GPU frequency for the iPad Air vs. iPhone 5s implementations of A7.
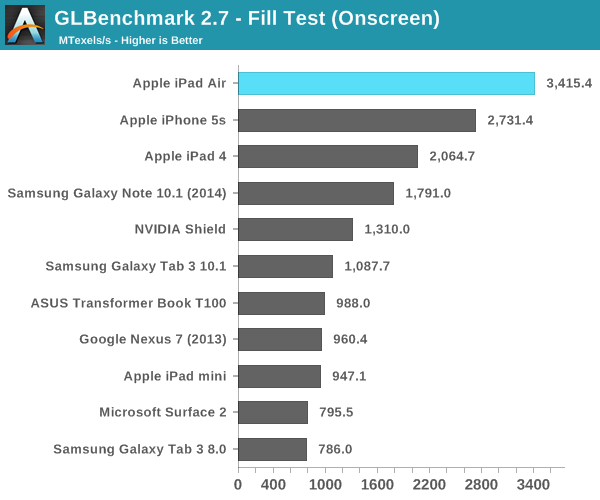
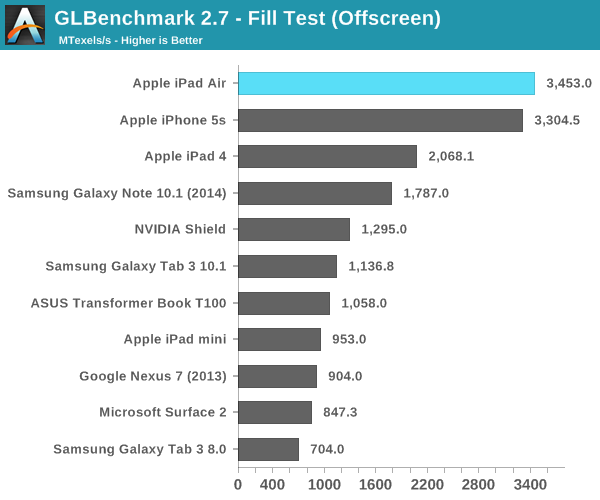
Looking at the fill rate results, there's a 4.5% increase in performance compared to the iPhone 5s. That could be the magnitude of clock increase that we're seeing between A7s. Apple could very well be relying on more thermal headroom in the iPad Air to provide any real world GPU performance advantages over the iPhone 5s.
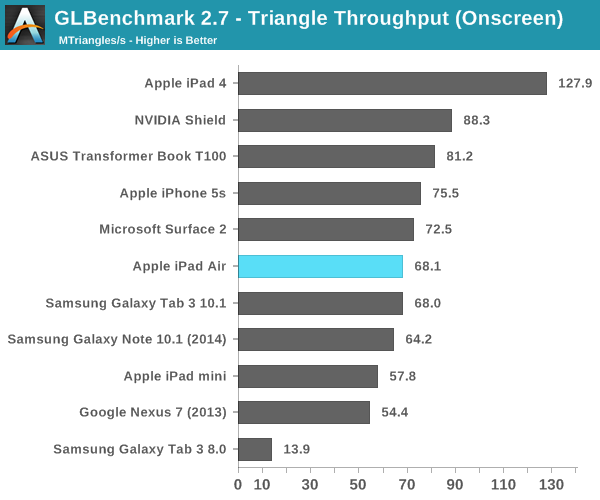
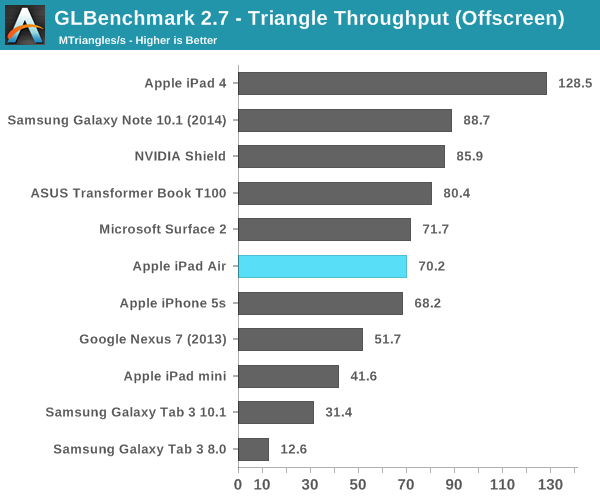
We see an even smaller gap between the Air and 5s in the triangle throughput tests (2.9%). There doesn't seem to be any substantial difference in GPU frequency between A7 implementations here. The regression in triangle rate performance compared to the iPad 4 is explained by differences in how Series 6 and Series 5XT GPUs scale in width. Whereas 5XT replicated nearly the entire GPU for "multi-core" versions, multi-cluster versions of Rogue only replicate at the shader array. The result? We don't see the same sort of peak triangle setup scaling we did back on multi-core 5XT parts. I'm not sure I'm particularly happy with the magnitude of the regression here, but I haven't seen any real world cases where it matters yet.
Next up are the game simulation tests. We'll start with the more strenuous of the two: T-Rex HD.
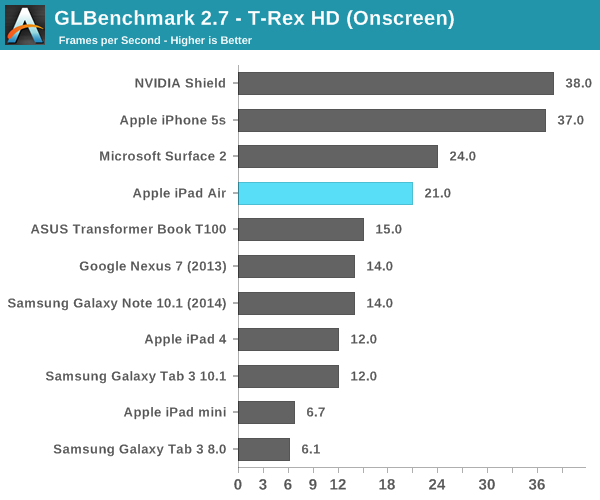
Here we get closer to Apple's claims of a 2x increase in performance. The iPad Air delivers 75% more performance than the iPad 4 in this test. Once again the iPhone 5s pulls ahead but that's because the onscreen tests render at display resolution, which is lower on the 5s.
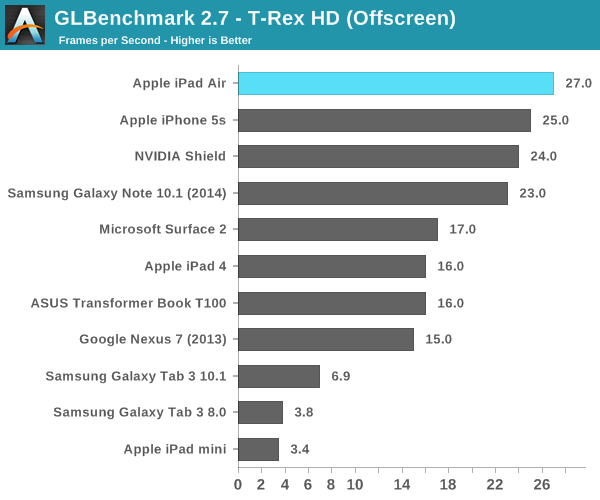
Offscreen performance sees similar scaling: ~69% better performance compared to the iPad 4.
3DMark
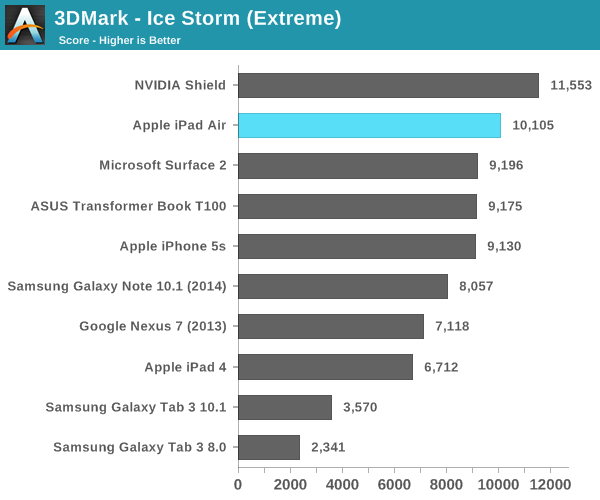
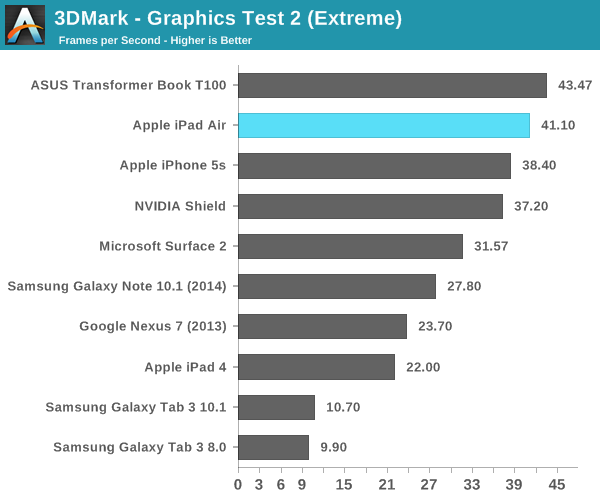
We're once again running 3DMark's newest Unlimited mode which does its best to run independently of v-sync and at a standard resolution across all devices. I've also included 3DMark Extreme results below that feature a few more comparison points.
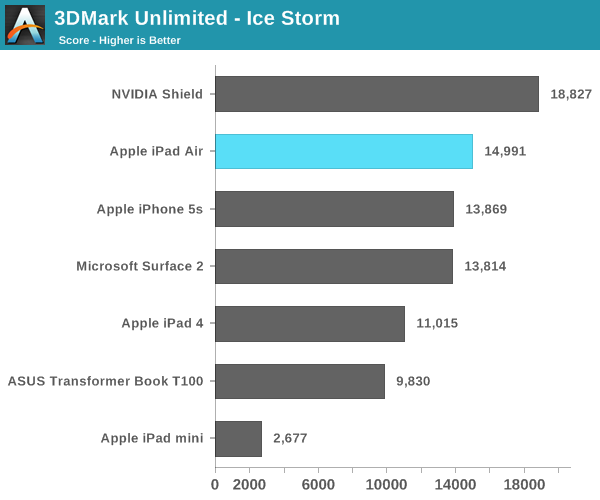
The overall Ice Storm scores show a 36% improvement in performance over the iPad 4 and an 8% increase compared to the iPhone 5s. Given the CPU frequency advantage of the A7 in the Air vs. the iPhone 5s, I'm guessing that's why we're seeing the performance gap we are here.
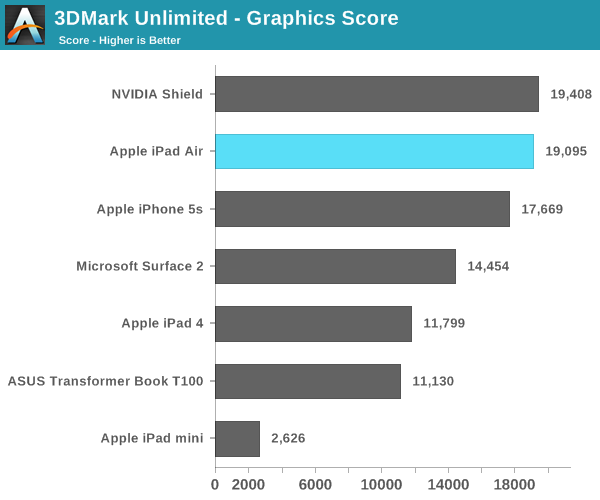
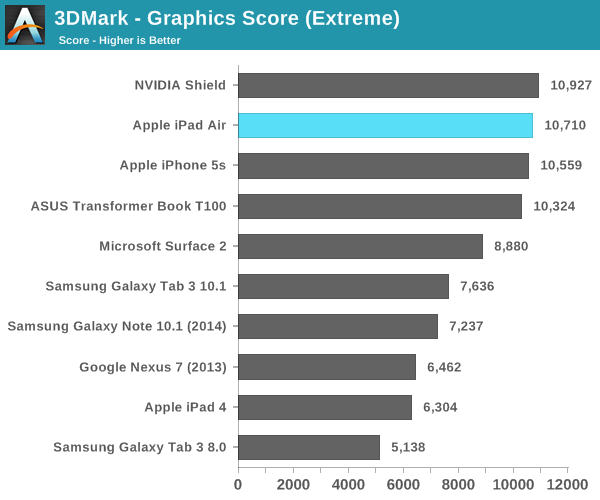
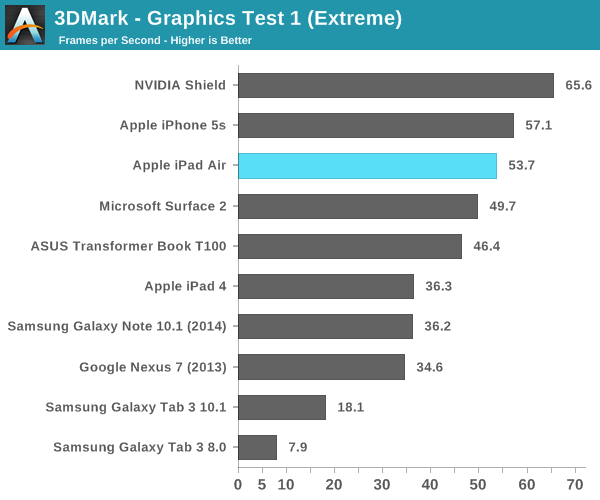
If we focus exclusively on the GPU tests (which themselves are still CPU bound), the iPad Air's performance advantage over the iPad 4 grows to over 60%.
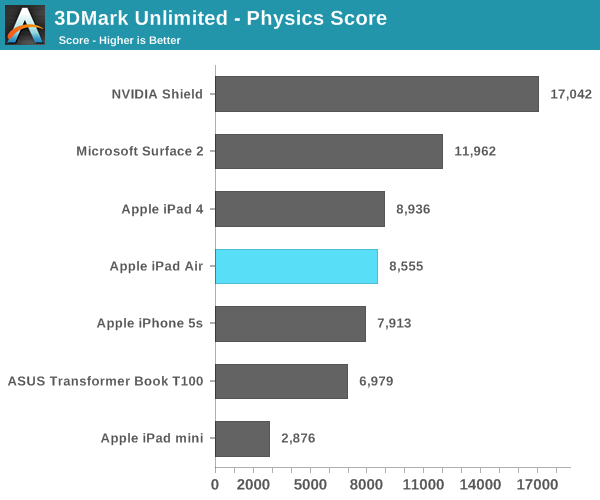
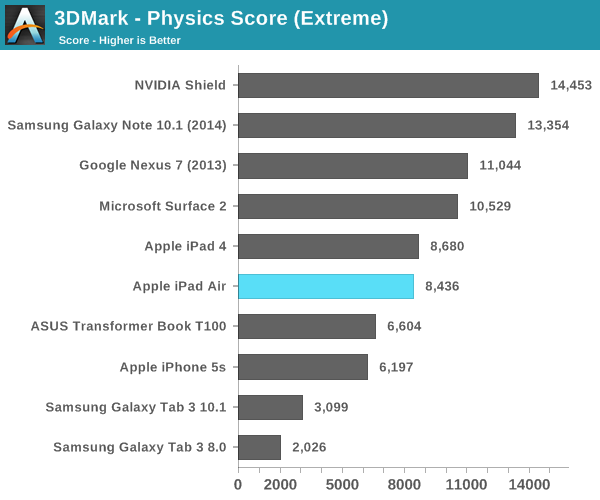
I'm still not entirely sure what's going on with the 3DMark Physics test, but we've seen this two reviews in a row now where Cyclone showed no performance increase at all compared to Swift despite this being largely a CPU test.
Basemark X
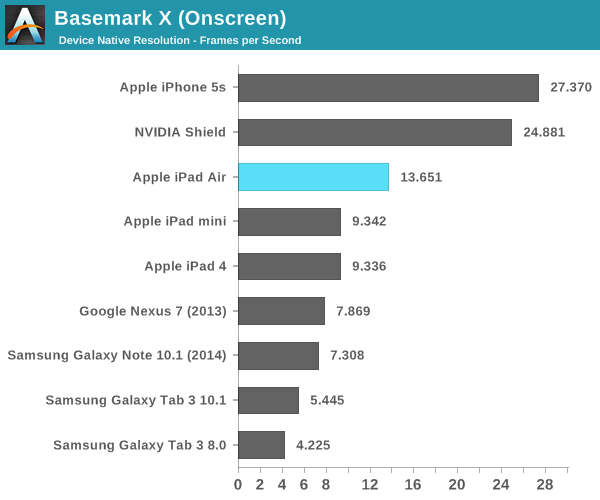
Basemark X is a new addition to our mobile GPU benchmark suite. There are no low level tests here, just some game simulation tests run at both onscreen (device resolution) and offscreen (1080p, no vsync) settings. The scene complexity is far closer to GLBenchmark 2.7 than the new 3DMark Ice Storm benchmark, so frame rates are pretty low.
I'm still having random issues with Basemark X reliably running both on and offscreen tests on iOS 7. Unfortunately I could only get onscreen results for the iPad Air, which came in at 46% faster than the iPad 4. Note the iPad mini and iPhone 5s benefit from having lower native resolutions here, which is why they perform so well.


444 Comments
View All Comments
errorr - Wednesday, October 30, 2013 - link
Kraken isn't as bad a some others. I'm convinced Anand includes sunspider for laughs more than anything.thunng8 - Wednesday, October 30, 2013 - link
I have doubts that Javascript benchmarks have a tilt on the A7.Safari's javascript engine is the weakest of the 3 major ones available on OS X Mavericks. I did a few benchmarks on my MacBook Pro 2.2Ghz Quad i7 (2011):
Chrome 30, Firefox 24, Safari 7
Sunspider 1.01 163, 169, 163
Lower is better .. they are about equivalent
Kraken 1.1 1471, 1692, 2212
Lower is better .. Chrome is about 50% faster than Safari in Kraken
Octane 1.0 19250, 15488, 14801
Higher is better.. Chroms is ~30% better than Safari
As iOs7 uses the same Javascript engine as Mavericks, Safari's engine is mediocre at best.
darkich - Wednesday, October 30, 2013 - link
Also, about the power consumption, Anand's notion about it probably being higher than that of the A6X is just horrendous - it is definitely clear that the A7 is much easier on battery than the A6X.Apple themeselves stated that the decrease in the iPad Air's battery size was possible because of the A7's power efficiency, Anand!
evilspoons - Wednesday, October 30, 2013 - link
It IS higher - when it is stressed to the maximum. It is capable of dissipating more power, period.However, because of the concept of race-to-idle, it finishes tasks faster and can go into a low-power state faster than the A6X, therefore using less power on average, resulting in longer battery life for a given battery capacity.
solipsism - Wednesday, October 30, 2013 - link
There also seems to be power savings with the display components. I wonder if IGZO is /finally/ utilized; although I would have expected Apple to dropped this buzz-word if they had finally incorporated that process.evilspoons - Wednesday, October 30, 2013 - link
Thank you for the comprehensive, high-quality review. Great job.I won't be buying an iPad Air as the value-per-dollar of the Nexus 7 is just too tempting for me, but I can safely recommend it to friends and family if they're interested. Looks like Apple did a really good job this time around.
jwdav - Wednesday, October 30, 2013 - link
Per square inch of screen, the Nexus 7 is 35% more expensive than the iPad:Apple’s iPad mini has a 7.9-inch display boasting 29.96 sq. inches of display area. That is 36% larger than Google’s plastic Nexus 7′s tiny 7-inch display’s 22.02 sq. inches. Google’s Nexus 7 offers a display that’s just 64% of Apple’s iPad mini. 64% of Apple’s $299 iPad mini price is $191.36, not $230.
So, why is Google’s tiny-screen Nexus 7 priced so high?
Braumin - Wednesday, October 30, 2013 - link
$299 mini - junk internals with an old 1024x768 screen$229 Nexus 7 - 1920x1200 screen, new internals.
What you meant to do was compare it to the mini retina, which is $399. Using your "logic" then the Nexus 7 should be $255, but it's not it's only $229. It gets real ugly after that if you try to compare the 32GB SKUs so don't.
I'm not a Nexus fan by any means but you look to be doing self-justification. That's a real thing check it out http://en.wikipedia.org/wiki/Self-justification
MarkWebb - Wednesday, October 30, 2013 - link
I think the iPad Air is mind-blowing. It's the tiny microPad, the Touch, that I feel sorry for, chugging along on an A5....tipoo - Wednesday, October 30, 2013 - link
I so want an A7 touch.