LG 29EA93 Monitor Review - Rev. 1.25
by Chris Heinonen on February 12, 2013 8:49 PM ESTWith our change to CalMAN, we will also now be evaluating displays for their grayscale and gamma point. Previously we only targeted a gamma of 2.2 in calibrations but never measured it in the end. Now we will be choosing two targets in our reviews. For light output of 200 cd/m², we will target the same gamma of 2.2 right now. 2.2 gamma is still a de-facto standard, and is the standard for Apple computers and devices as well as video content. For our second calibration we target 80 cd/m² with an sRGB gamma curve. Both of these are specified in the sRGB standard, so those doing professional print or computer graphics work would likely want this.
Hopefully a display will be able to handle both of these tests, and we will also check for the grayscale quality on its own by checking 21 points, just like we do with our tablet and smartphone reviews. This will provide you with more data, as well as consistent data for the different devices.
| Pre-Calibration | 200 cd/m² Target | 80 cd/m² Target | |
| White Level | 201.5 | 198.4 | 80.1 |
| Black Level | 0.1689 | 0.1644 | 0.067 |
| Contrast Ratio | 1193:1 | 1207:1 | 1197:1 |
| Average CCT | 6545 | 6537 | 6599 |
| Gamma | 2.1648 | 2.2128 | 2.4109 |
| Average dE2000 | 2.3847 | 0.535 | 0.6238 |
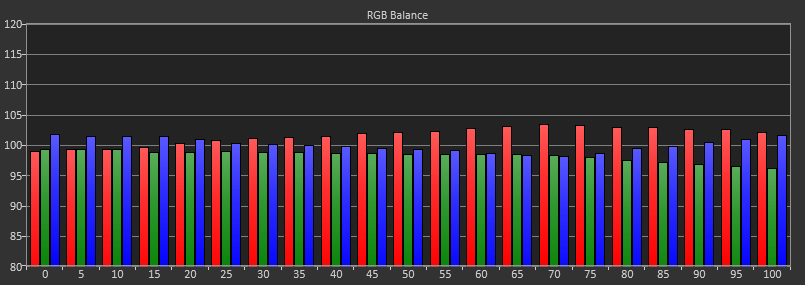
Looking at the RGB Balance for the data, the pre-calibration data starts out a bit too-blue, then develops a red tint, before finally winding up with a lack of green at the top of the grayscale. The average CCT remains close to 6503K overall, but the RGB balance shows that there is a lack of correct balance in there. Looking at the post-calibrations numbers for 200 and 80 cd/m², we see almost no deviation at all in the RGB balance, which is much better. The 80 cd/m² results have a bit too much blue perhaps, but overall they're acceptable.
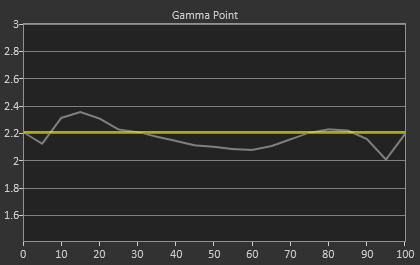
The pre-calibration gamma point is very close to the 2.20 target, but looking at the chart we see some issues. The gamma point rises and falls across the grayscale, which will leads to midtones and highlights not having the correct level of light output, and will lead to a less dynamic image. The overall number is good, but the chart shows that it’s not quite right. The 2.20 target for our 200 cd/m² calibration is much better, with a very linear 2.20 gamma across the whole grayscale. There are a couple small bumps in there, but nothing that would be visible in daily use.
The sRGB target is different, as the gamma isn’t linear across the whole grayscale. Instead the shadows start at 1, and it ramps up as you leave the shadows, which results in an average gamma across the grayscale of 2.40 in the end. Because of this it’s far more important to look at the actual graph than the final number, and here the LG 29EA93 does very well at tracking the target. Once calibrated, the gamma curve for the LG is very good with either sRGB or Power Law targets.
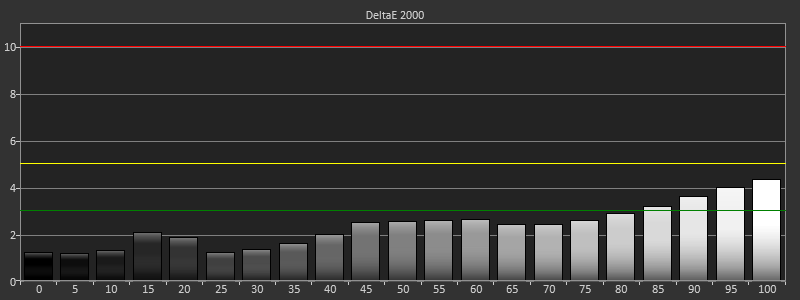
The grayscale dE2000 values takes all of this data into account. Pre-calibration, the dE2000 starts out well in the shadows, but by the end of the grayscale we have dE2000 values above 3, indicating a visible grayscale error that we can see even in motion. The average error is pretty low, but by the end it’s higher than we would like. Post-calibration, both grayscales are free of all visible error. There isn’t a single point that is above 2.0, and no one should be able to see any errors in real world use. In the end, the grayscale is basically perfect for these displays after calibration.
Pre-calibration, the LG 29EA93 is good, but not great. Post-calibration, it’s virtually perfect and will be basically free of visible errors when being used.


108 Comments
View All Comments
Lifted - Tuesday, February 12, 2013 - link
Just to clarify, that was all on the homepage, before clicking on the review. I only clicked on the review as the last tiny little paragraph, tucked in below the image, gave a clue that it may be worth a read. That last paragraph should go up top.inighthawki - Tuesday, February 12, 2013 - link
Same here, I almost stopped reading after about two sentences. The only reason I continued was because I believed down to earth there had to be a "but" in there somewhere, nobody could actually start a review and just say "it's bad" and be done with it :).bovinda - Tuesday, February 12, 2013 - link
I actually liked the way it was done - it set the stage well. I actually think the first few sentences do a good job of piquing one's curiosity, for exactly the reasons inighthawki stated. I wouldn't have changed it. To each their own. :)niva - Tuesday, February 12, 2013 - link
Right on, this is exactly how I felt. The title and first few words in this article almost caused me to not read thinking it was a bad product... subsequently it turned out it's actually a really good display.THizzle7XU - Tuesday, February 12, 2013 - link
Ya, the entire opening of this article made it sound like the first review was a disaster of a product. I went back to read it and it was actually a mixed, leaning positive review of the 1.09 version. And this is the much improved version.Very misleading opening...
cheinonen - Wednesday, February 13, 2013 - link
Alright, I'll get an edit in there then to make it more clear. I liked the opening, but it seems that what is clear in my head certainly didn't get communicated well once it was written.wujj123456 - Tuesday, February 12, 2013 - link
Does anyone know detailed documentations of how to perform these calibration and tests? I just searched a bit, and the CalMAN software/tool doesn't seem to be expensive. I'd love to get a hold of it so that I can calibrate my own monitors.I've been long aware that many monitors look so awful without calibration, but without a good workflow, I was just messing around until I am comfortable with what I saw...
jjj - Tuesday, February 12, 2013 - link
It's not so much about the software but the hardware , you can try to rent or find a store that calibrates screens for cheap or at the very least try the ICC profiles on TFT Central.,if they have one for your screen.cheinonen - Wednesday, February 13, 2013 - link
The PC portion of CalMAN is still in an Open Beta, which is why the uniformity numbers aren't taken from CalMAN. I can export all of the data to use, but I can't have it generate the charts for me the way that I want them yet.The real cost is hardware. As mentioned in the LG Calibration Hardware review, I'm using an i1Pro ($900 or so), a SpectraCal C6 ($700), and CalMAN ($400 or so for this package). You can get decent results with a cheaper meter, but it can also be hit-and-miss depending on the display. Most PC calibration is fairly automated, it's video displays that take a lot more work to get right.
CalMAN has a free download available I believe. It only uses a simulated meter, so you can't take actual measurements, but you could get that and then the open beta of the PC Calibration Workflow on their forums and see how it works.
kevith - Tuesday, February 12, 2013 - link
Watch out, or that's gonna be your new title...Nice review.