Intel Core i9-13900K and i5-13600K Review: Raptor Lake Brings More Bite
by Gavin Bonshor on October 20, 2022 9:00 AM ESTCore-to-Core Latency
As the core count of modern CPUs is growing, we are reaching a time when the time to access each core from a different core is no longer a constant. Even before the advent of heterogeneous SoC designs, processors built on large rings or meshes can have different latencies to access the nearest core compared to the furthest core. This rings true especially in multi-socket server environments.
But modern CPUs, even desktop and consumer CPUs, can have variable access latency to get to another core. For example, in the first generation Threadripper CPUs, we had four chips on the package, each with 8 threads, and each with a different core-to-core latency depending on if it was on-die or off-die. This gets more complex with products like Lakefield, which has two different communication buses depending on which core is talking to which.
If you are a regular reader of AnandTech’s CPU reviews, you will recognize our Core-to-Core latency test. It’s a great way to show exactly how groups of cores are laid out on the silicon. This is a custom in-house test, and we know there are competing tests out there, but we feel ours is the most accurate to how quick an access between two cores can happen.
(Click on image to enlarge)
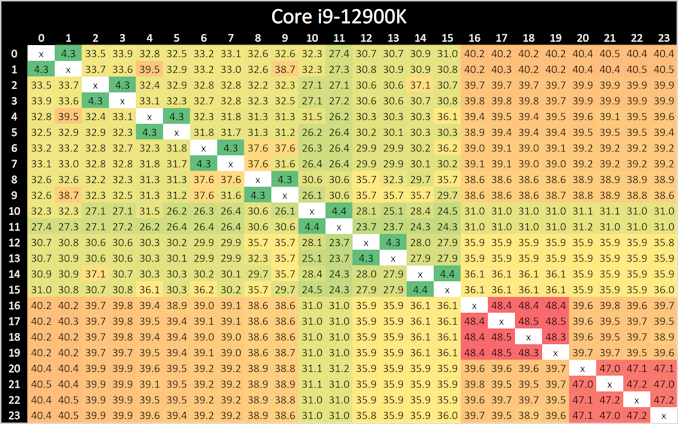
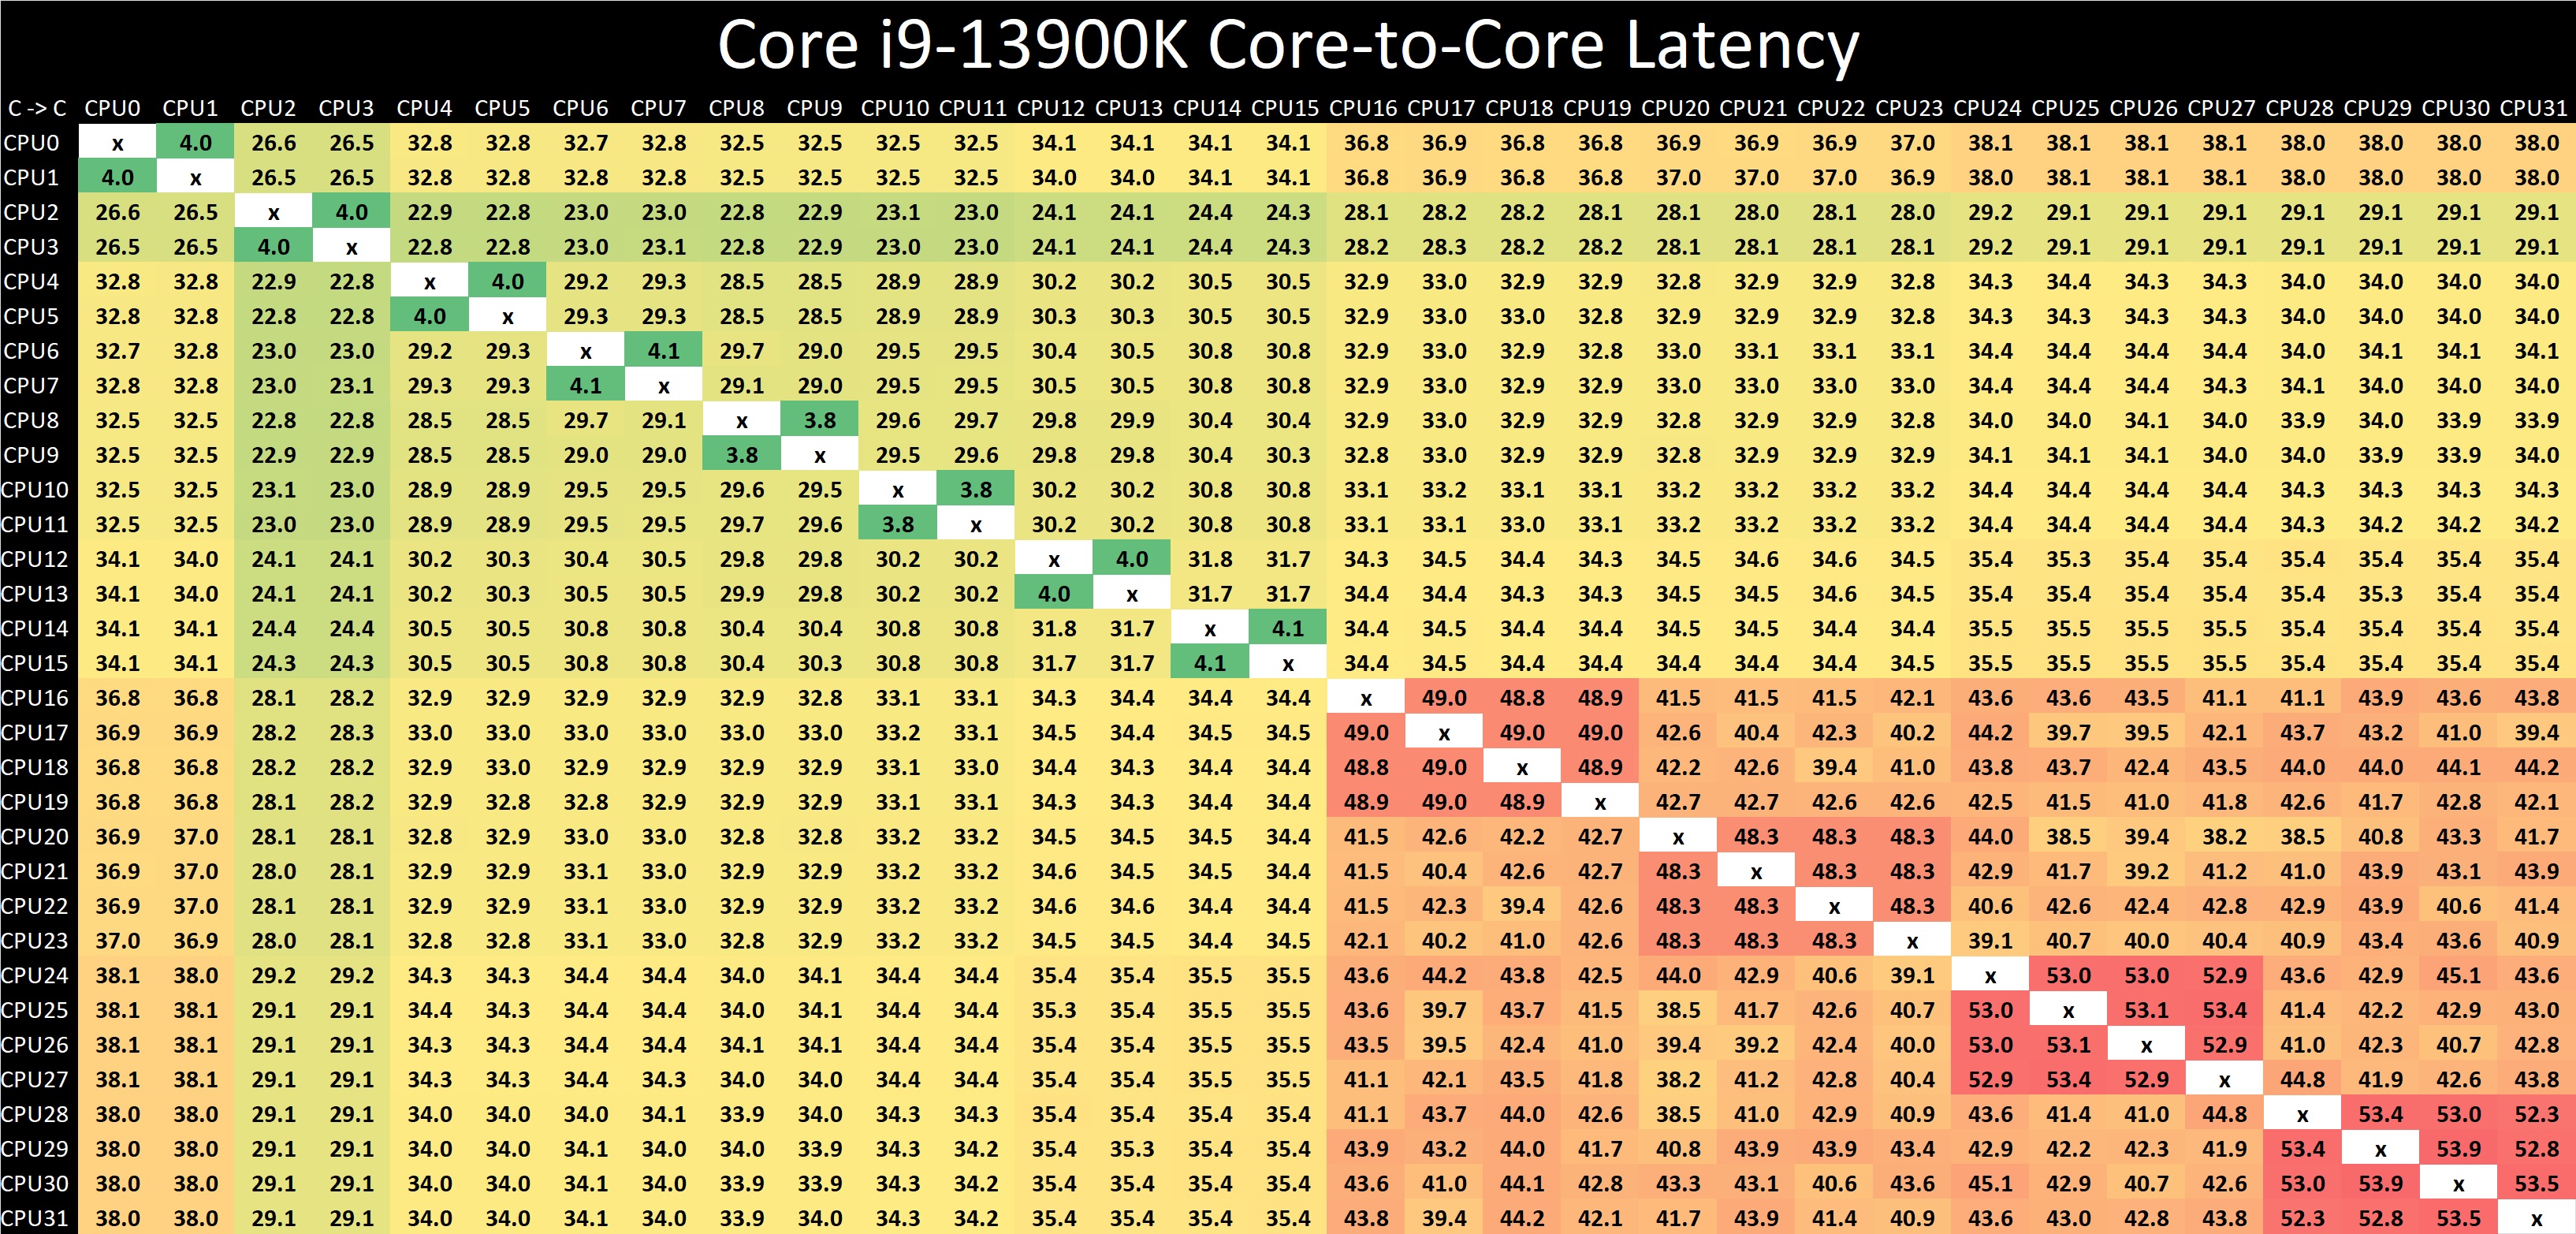
Looking at core-to-core latencies going from Alder Lake (12th Gen) to Raptor Lake (13th Gen), things look quite similar on the surface. The P-cores are listed within Windows 11 from cores 0 to 15, and in comparison to Alder Lake, latencies are much the same as what we saw when we reviewed the Core i9-12900K last year. The same comments apply here as with the Core i9-12900K, as we again see more of a bi-directional cache coherence.
Latencies between each Raptor Cove core have actually improved when compared to the Golden Cove cores on Alder Lake from 4.3/4.4 ns, down to 3.8/4.1 ns per each L1 access point.
The biggest difference is the doubling of the E-cores (Gracemont) on the Core i9-13900K, which as a consequence, adds more paths and crossovers. These paths do come with a harsher latency penalty than we saw with the Core i9-12900K, with latencies around the E-cores ranging from 48 to 54 ns within four core jumps between them; this is actually slower than it was on Alder Lake.
One possible reason for the negative latency is the 200 MHz reduction in base frequency on the Gracemont cores on Raptor Lake when compared with Alder Lake. When each E-core (Gracemont) core is communicating with each other, they travel through the L2 cache clusters via the L3 cache ring and back again, which does seem quite an inefficient way to go.


169 Comments
View All Comments
m53 - Thursday, October 20, 2022 - link
PCs are idle (or used for light browsing, reading bews, watching youtube or a movie, etc.) most of the time. Intel idles at around 12W due to E cores while AMD idles at around 45W which will make the energy consumption 4x. Replyt.s - Thursday, October 20, 2022 - link
idle around 45w? sources? My 5600G idle at 11W. others, around 7 s/d 17W. Replytitaniumrock - Thursday, October 20, 2022 - link
here is the source link https://www.youtube.com/watch?v=UNmpVvTUkJE&li... Replyt.s - Friday, October 21, 2022 - link
And where it states the AMD vs Intel watt vs watt? ReplyWrs - Friday, October 21, 2022 - link
A 5600g is a monolithic chip, just like the Intels. A 7600x or 7950x is a multi-chip module, though, with 2 or 3 modules, and the IOD idle is very substantial now with all the PCIe5 lanes. Bottom line Zen 4 is more efficient when doing major work, courtesy of being one process generation ahead, but Raptor Lake and Alder Lake idle lower. If you want low idle with Zen4, wait for the SoC variants like your 5600g. Replytygrus - Saturday, October 22, 2022 - link
They don't run constantly with at maximum power consumption in all workloads. They use less while gaming or more integer & less FP/AVX. Highest usage probably when they have a performance lead over the other. AMD can run at lower power limits & loose a few % in many cases. Replyneblogai - Thursday, October 20, 2022 - link
I was hoping for Ryzen 7000X iGPU benchmarks too. There are no proper comparisons of them vs Intel's 32EU iGPUs on the internet. Replynandnandnand - Thursday, October 20, 2022 - link
ETA Prime 7700X iGPU tests (no comparisons):https://www.youtube.com/watch?v=p4cwNn4kI6M (gaming)
https://www.youtube.com/watch?v=MnSVPM78ZaQ (emulation)
7600X vs. 12900 vs. 5700G
https://arstechnica.com/gadgets/2022/09/ryzen-7600...
All Zen 4 vs. 12900K vs. others
https://www.techpowerup.com/review/amd-ryzen-7-770...
It's similar to the UHD 770 in Alder Lake, sometimes a little better or worse. About half the performance of a 5700G which is impressive for 2 CUs.
UHD 770 in Raptor Lake gets +100 MHz across the board, so that could make a slight difference. Reply
neblogai - Thursday, October 20, 2022 - link
Thanks. I liked the ones on Techpowerup, as they include tests at 720p low, and tested more than a few titles. Part of my interest is the need to compare to Tomshardware 7950 iGPU results, which looked suspiciously low for the specs, and probably faulty: https://www.tomshardware.com/news/ryzen-7000-integ... ReplyCiccioB - Thursday, October 20, 2022 - link
About power consumption.I think it is completely useless to measure it when running a useless benchmark that you then don't even use to compare the relative performances to other CPUs.
It would be much worth having a measurement for some more useful (common?) benches, just to understand when a real work is applied how much the CPU is consuming and, related to the performances, understand how efficient it is.
Just think what the results would be if the CPU would be artificially limited (by BIOS/driver) in Prime95 bench: you would measure a much lower consumption that extrapolated for other tests, and you could just think the CPU is consuming a fraction of what is does. It's the same for the torture benches of GPUs. The max consumption in that test is useless to understand how much they really consume while gaming, and in fact, most of them are artificially limited or just hit the max TDP (which is again not a measure of power consumption).
If you don't want to provide the power consumption for most benches, at least use a bench that gives a comparable performance, so that (at least for that test) one can make a comparison of the efficiency. Reply