Intel Core i9-13900K and i5-13600K Review: Raptor Lake Brings More Bite
by Gavin Bonshor on October 20, 2022 9:00 AM ESTCore-to-Core Latency
As the core count of modern CPUs is growing, we are reaching a time when the time to access each core from a different core is no longer a constant. Even before the advent of heterogeneous SoC designs, processors built on large rings or meshes can have different latencies to access the nearest core compared to the furthest core. This rings true especially in multi-socket server environments.
But modern CPUs, even desktop and consumer CPUs, can have variable access latency to get to another core. For example, in the first generation Threadripper CPUs, we had four chips on the package, each with 8 threads, and each with a different core-to-core latency depending on if it was on-die or off-die. This gets more complex with products like Lakefield, which has two different communication buses depending on which core is talking to which.
If you are a regular reader of AnandTech’s CPU reviews, you will recognize our Core-to-Core latency test. It’s a great way to show exactly how groups of cores are laid out on the silicon. This is a custom in-house test, and we know there are competing tests out there, but we feel ours is the most accurate to how quick an access between two cores can happen.
(Click on image to enlarge)
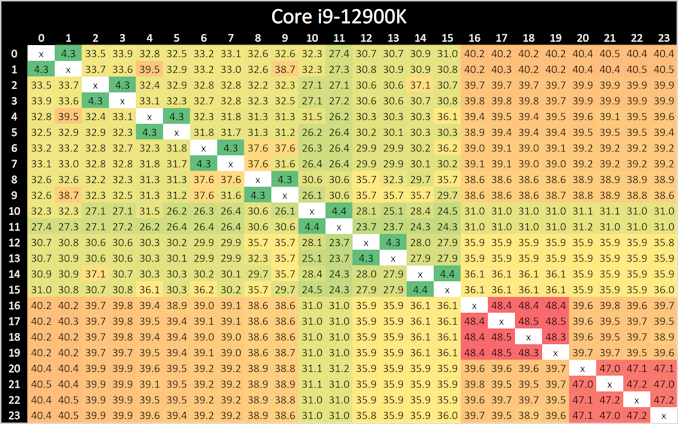
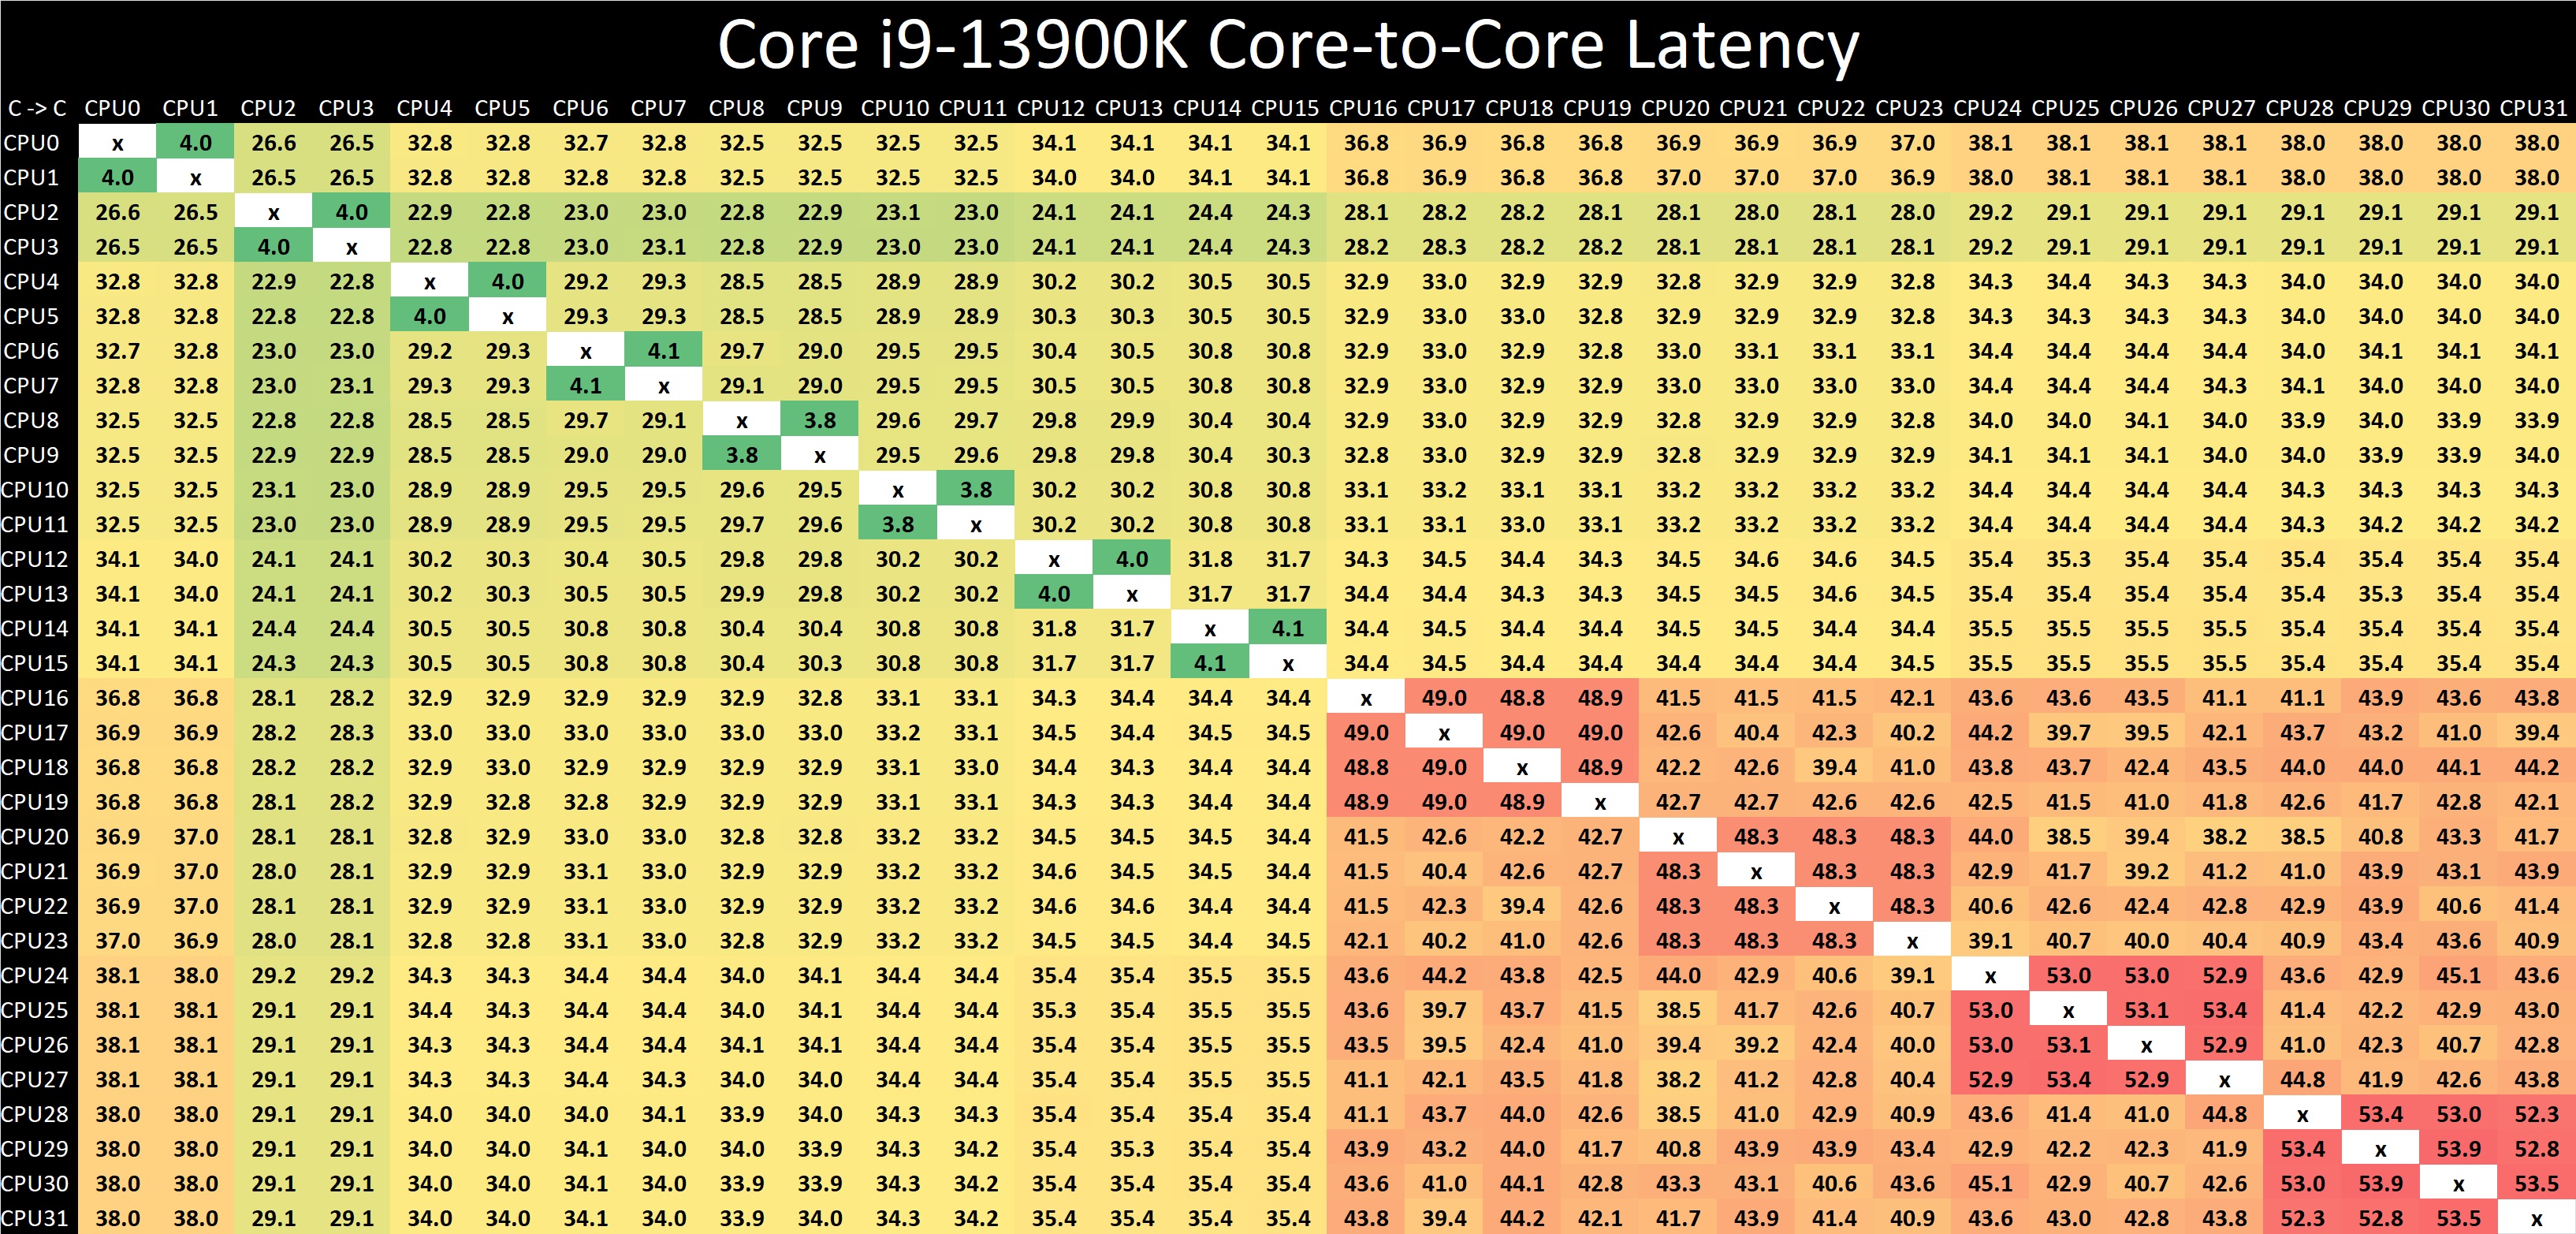
Looking at core-to-core latencies going from Alder Lake (12th Gen) to Raptor Lake (13th Gen), things look quite similar on the surface. The P-cores are listed within Windows 11 from cores 0 to 15, and in comparison to Alder Lake, latencies are much the same as what we saw when we reviewed the Core i9-12900K last year. The same comments apply here as with the Core i9-12900K, as we again see more of a bi-directional cache coherence.
Latencies between each Raptor Cove core have actually improved when compared to the Golden Cove cores on Alder Lake from 4.3/4.4 ns, down to 3.8/4.1 ns per each L1 access point.
The biggest difference is the doubling of the E-cores (Gracemont) on the Core i9-13900K, which as a consequence, adds more paths and crossovers. These paths do come with a harsher latency penalty than we saw with the Core i9-12900K, with latencies around the E-cores ranging from 48 to 54 ns within four core jumps between them; this is actually slower than it was on Alder Lake.
One possible reason for the negative latency is the 200 MHz reduction in base frequency on the Gracemont cores on Raptor Lake when compared with Alder Lake. When each E-core (Gracemont) core is communicating with each other, they travel through the L2 cache clusters via the L3 cache ring and back again, which does seem quite an inefficient way to go.


169 Comments
View All Comments
adenta180 - Friday, June 23, 2023 - link
Did you guys ever get to the bottom of this SPECint rate GCC regression on 13900K? ReplyAvalon - Friday, October 21, 2022 - link
I think it's starting to become a little disingenuous to list the default TDP in the benchmarks, when it's become increasingly obvious over the past few generations that Intel chips run nowhere in the stratosphere of those TDPs.When you see a "125W" $589 chip virtually tied with a "170W" $699 chip it makes it seem like Intel is a no brainer. Might be time to start putting actual power draw in each of the tests in there, or simply leave stock TDP out, because listing a Core i9 at "125W" when it's running 50-100W higher than an equivalent AMD chip doesn't make much sense any longer. Reply
WannaBeOCer - Friday, October 21, 2022 - link
Did you even read the article? Intel advertises the 13900k as a 253w chip. It drew 32% more than it advertised while AMD advertises its 7950x as a 170w and it drew 30% more than they advertised. On all of Intel’s slides“Processor Base Power
125 W
Maximum Turbo Power
253 W” Reply
bcortens - Saturday, October 22, 2022 - link
Doesn’t matter if they advertise it. The charts are misleading because the W number at the left of the chart has nothing to do with the power consumed to get the performance indicated in the chart.They should really just leave the W number off or show a measured average W required to complete the test. Then the number would have meaning. As it stands, for the purposes of the graph, the number doesn’t mean much. Reply
Avalon - Friday, October 21, 2022 - link
And, to be fair to Intel, why are some of the IGP gaming benchmarks only showing the 12th and 13th gen Intel vs AMD APUs? There's really nothing to be gleaned from this; of course APUs will be faster in IGP tests. If you can't do like for like, then either just publish the Intel scores or don't publish at all. ReplyIketh - Friday, October 21, 2022 - link
In your closing comments about power consumption, I was reminded about the AMD article that compared the performance difference between 230W and 65W. I think you should also mention that in this article. I'm holding out for AMD mobile parts. Those laptops will be nice. ReplyIketh - Friday, October 21, 2022 - link
125W on Intel 7 process, when it's actually 325W on 10nm lmao... pure marketing ReplyWannaBeOCer - Friday, October 21, 2022 - link
Did you even read the article? Intel advertises the 13900k as a 253w chip. It drew 32% more than it advertised while AMD advertises its 7950x as a 170w and it drew 30% more than they advertised. On all of Intel’s slides“Processor Base Power
125 W
Maximum Turbo Power
253 W” Reply
bcortens - Saturday, October 22, 2022 - link
Reviews shouldn’t care about the advertised power, or what it says in the bios when you set the “limit” to 65 watts, reviews should actually measure and report the real power draw.We don’t read reviews to read intel and amd marketing numbers, we want to know the real numbers for a given workload Reply
Iketh - Sunday, October 23, 2022 - link
what on earth does that have to do with my statement Reply