The Western Digital WD Black SN750 SSD Review: Why Fix What Isn't Broken?
by Billy Tallis on January 18, 2019 8:01 AM ESTWhole-Drive Fill
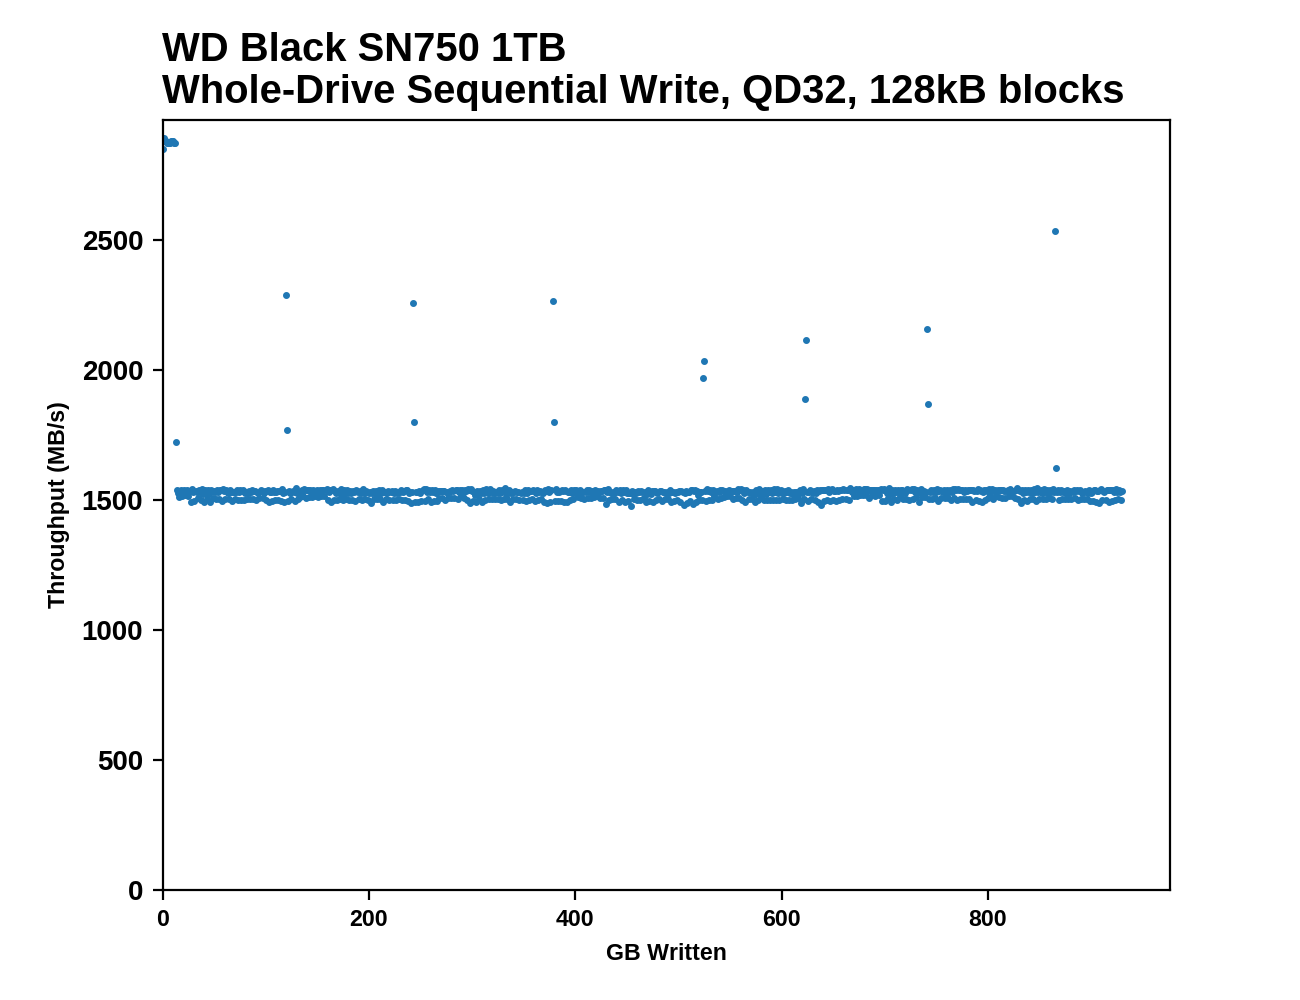
This test starts with a freshly-erased drive and fills it with 128kB sequential writes at queue depth 32, recording the write speed for each 1GB segment. This test is not representative of any ordinary client/consumer usage pattern, but it does allow us to observe transitions in the drive's behavior as it fills up. This can allow us to estimate the size of any SLC write cache, and get a sense for how much performance remains on the rare occasions where real-world usage keeps writing data after filling the cache.
 |
|||||||||
The WD Black SN750's behavior during a full drive write is quite similar to that of its predecessor, albeit with a 5% improvement in write speed after the SLC cache fills up. The cache fills after about 12GB of writes, but since performance after the drop is steady at around 1.5GB/s the small cache isn't really a problem.
 |
|||||||||
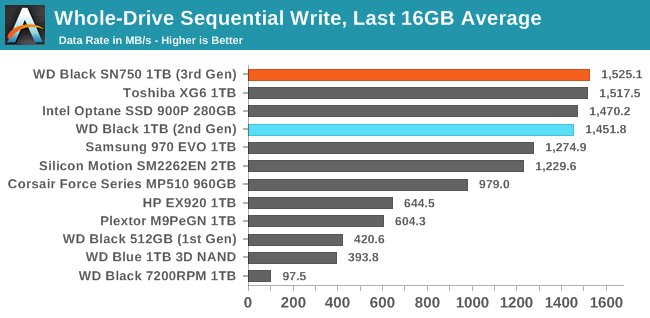
| Average Throughput for last 16 GB | Overall Average Throughput | ||||||||
The WD Black SN750 offers best in class performance for long-duration sequential writes. After the SLC cache is full, the SN750 is about 5% faster than its predecessor for filling the rest of the drive. When looking at the total time to fill the drive, the SN750's advantage is slightly higher because its write speed to the SLC cache is also a bit faster.
BAPCo SYSmark 2018
BAPCo's SYSmark 2018 is an application-based benchmark that uses real-world applications to replay usage patterns of business users, with subscores for productivity, creativity and responsiveness. Scores represnt overall system performance and are calibrated against a reference system that is defined to score 1000 in each of the scenarios. A score of, say, 2000, would imply that the system under test is twice as fast as the reference system.
SYSmark scores are based on total application response time as seen by the user, including not only storage latency but time spent by the processor. This means there's a limit to how much a storage improvement could possibly increase scores, because the SSD is only in use for a small fraction of the total test duration. This is a significant difference from our ATSB tests where only the storage portion of the workload is replicated and disk idle times are cut short to a maximum of 25ms.
| AnandTech SYSmark SSD Testbed | |
| CPU | Intel Core i5-7400 |
| Motherboard | ASUS PRIME Z270-A |
| Chipset | Intel Z270 |
| Memory | 2x 8GB Corsair Vengeance DDR4-2400 CL17 |
| Case | In Win C583 |
| Power Supply | Cooler Master G550M |
| OS | Windows 10 64-bit, version 1803 |
Our SSD testing with SYSmark uses a different test system than the rest of our SSD tests. This machine is set up to measure total system power consumption rather than just the drive's power.
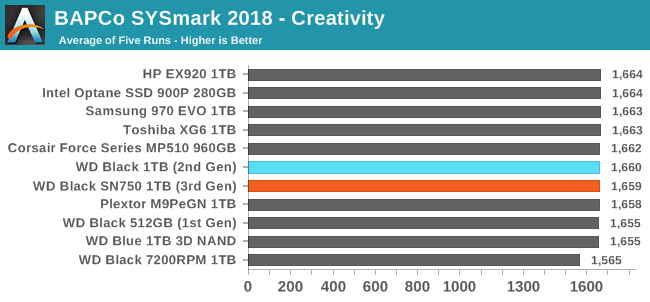
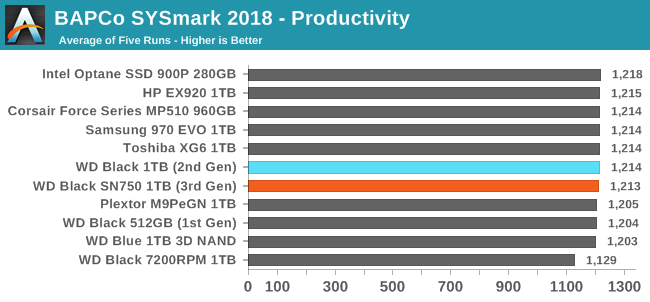
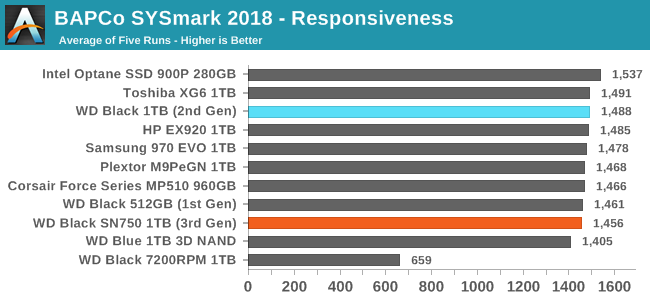
The new WD Black SN750 regresses slightly in performance on SYSmark 2018, primarily on the responsiveness test, which is the subscore that's most sensitive to storage performance. The SN750 still clearly outperforms the WD Blue SATA SSD but even managed to fall behind the first-generation WD Black that used planar TLC and a third-party controller.
Energy Usage
The SYSmark energy usage scores measure total system power consumption, excluding the display. Our SYSmark test system idles at around 26 W and peaks at over 60 W measured at the wall during the benchmark run. SATA SSDs seldom exceed 5 W and idle at a fraction of a watt, and the SSDs spend most of the test idle. This means the energy usage scores will inevitably be very close. A typical notebook system will tend to be better optimized for power efficiency than this desktop system, so the SSD would account for a much larger portion of the total and the score difference between SSDs would be more noticeable.
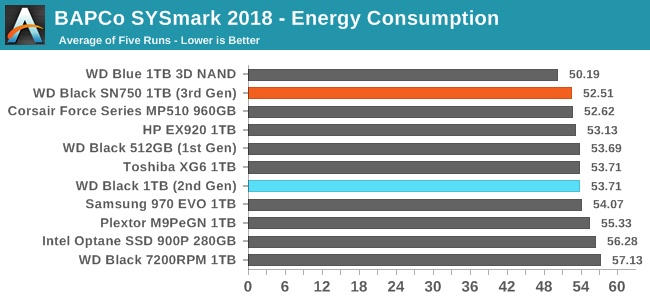
The WD Black SN750 turns in an excellent energy consumption score, lower than any drive in this bunch save for the WD Blue SATA SSD.


54 Comments
View All Comments
namechamps - Friday, January 18, 2019 - link
Strangely enough I don't think anandtech has ever reviewed the 970 Pro which is likely why it isn't in the comparison. They have done the 960 pro and the 970 evo but not the 970 pro.Ryan Smith - Friday, January 18, 2019 - link
"Whatever happend to the Samsung PRO in those comparisons?"Unfortunately Samsung never sampled the 970 PRO, so we don't have it on hand. And all indications are that they're just about done with it, having never released a 2TB version (like they did the 960 PRO).
I'm really not sure if we're going to see any new consumer MLC drives in 2019. The market has bifurcated into TLC and then more boutique solutions like Z-NAND and 3D XPoint.
althaz - Friday, January 18, 2019 - link
The 512Gb drive is a ~$150 part, just buy it and test it? To many this remains the most prestigious tech site around for at least some things. SSDs have been one of those things. Not having the latest of Samsung's pro drive in your results kinda makes this whole thing not worth it, IMO.If you need an excuse do a "MLC Redux" review where you look at what was probably the faster ever MLC drive and talk about how SSD tech has changed.
eldakka - Friday, January 18, 2019 - link
" just buy it and test it?"I'm sure anandtech would be delighted to test it if you sample one to them, or donate $150 to them to purchase one with.
GreenReaper - Saturday, January 19, 2019 - link
This is the level of a business expense though. Even if you did one a day for every day of the year it would be $53,400. OK, you could get a full-time journalist for that in some places, but that assumes they are kept and not sold on or used for anything else.Solandri - Monday, January 21, 2019 - link
More troubling is that unwillingness to buy a product for review smacks of demanding bribes. "Give us a free sample or we won't review your product." Which implies that companies which shower the reviewer with gifts will get more favorable reviews.Ideally, a review site should *never* accept free samples, and do all their product reviews with samples bought from the store. That's the only way to completely eliminate any undue influence the product manufacturer may have on the product review.
Dark_wizzie - Friday, January 18, 2019 - link
I don't think they actually reviewed the 970 Pro?StevoLincolnite - Saturday, January 19, 2019 - link
Yeah. Comparisons have been a bit crap on Anandtech lately.The RTX 2080 review is lacking a good lineup of GPU's to compare with... Despite promises of "Adding more later". (Never happened sadly.)
joesiv - Friday, January 18, 2019 - link
I would love to see at least some endurance testing in anandtechs reviews. I think it's something that's missing pretty much all SSD testing I see. Yes, speed is great, but endurance is something perspective owners will care more about in the long term.NAND technology is changing over time, is it changing for the better? More layers, but often at the expense of P/E Cycles.
SSD Firmwares as well have gotten both a lot more reliable, but also a lot more complicated, with different companies doing different things to maximize performance and also endurance.
Without testing these things, we don't know if there are duds in terms of firmwares/drives that don't strike a good balance between performance/reliability.
Bare minimimum I would love to see ananadtech do the following:
- Talk to manufacturers about the actual specifications of the NAND, what is the P/E Cycle rating for the NAND. Then list it in the specs for the drives so we can do our own research/homework if we want to. This spec is very often missed in the most marketing material.
- Do a quick capture of the SMART data at the very start of the testing
- Do a capture of the SMART data at the very end of your testing.
- Check out the Block Erase Count specifically. The Average Block Erase count would give a good approximation of how much life you've used just within your benchmark suite. It's much more grainular than Percent Life Used. This SMART attribute can vary between different manufacturer/firmware/controllers, so you might need to contact the manufacturer for this info.
In the end, you'll have something like: Rated P/E count / Average Block Erase, and since your test suite is likely pretty similar between SSD's, it would be a useful metric.
Bonus points, you could also look at NAND writes (not to be confused with Host Writes), during your testing, as it's related to life expectancy and can be corrolated with Total Byte Written.
I wouldn't be surprised to see that some drives write a lot more to NAND than you are expecting, and thus have higher Average Block Erases during your testing.
At my company when I did this test, while we were evaluating a drive for our products, Tier 1 memory manufacturers and their drives, failed bitterly at this endurance test where most did fine. I attribute this to the firmware. Working with the firmware developement team, we determined that the fix would not be feasible in that generation of product, so we had to skip that product.
Specs aren't everything, we need to test it, endurance is an important aspect, and I'd love to see it represented in your reviews.
romrunning - Friday, January 18, 2019 - link
Whom do you consider to be "Tier 1 memory manufacturers" - Samsung or Intel? I can't imagine their products failing endurance tests. Or are you talking about those you would consider to be lower than Samsung - like AData, Team Group, etc. - as a Tier 2 or Tier 3?